TRADING SYSTEMS
How Will Your System Perform In The Long Run?
Equity Curve Analysis
by Vladimir Stepnov
What can you expect from your trading system?
The random nature of the markets can alter your profit expectations, which is why you must determine how your system will perform in any type of market. When you design a system, the main parameters that characterize its performance are the percentage of winners (hereafter referred to as p) and the win/loss ratio (hereafter referred to as alpha, a). The value of p is calculated by dividing the number of winning trades by the total number of trades during the test period, and a is the ratio of average winning trades to average losing ones.
Suppose your trading system shows stable performance on a large number (N) of historical tests with a fixed p and a parameter set. What kind of performance can you expect from this trading system? For starters, there'll be on average N*p winners, each gaining a amount of dollars, and N*(1-p) losers, each decreasing the account balance by one dollar. After making N trades you can calculate your profit (loss) using the following formula:
<W> = a Np N(1-p) = N (a p 1 + p)
Note that this formula is normalized for a $1 loss. If it results in a positive number, then the system is profitable in the long run. If not, then you should think about trading another system.
Consider a concrete example with p equal to 0.60 and a equal to 1.2. After 30 trades (N = 30), you should expect to earn, on average, $9.60.
<W> = 30* (1.2*0.6 1 + 0.6) = 9.60
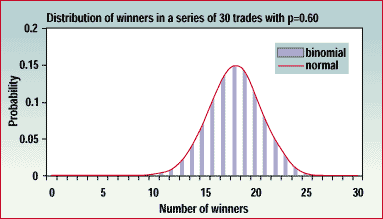
The number of winners should be 18 (30*0.60) and the number of losers should be 12 (30*0.40). But keep in mind this is only the most probable expectation. Since the outcome of a single trade is completely random and independent of the preceding trade, chances are that you won't have exactly 18 winners, but perhaps 16, 17, 19, 20, or any other number from zero to 30. As a result, your final profit/loss may be anything from -$30 (worst-case scenario) to +$36 (best-case scenario).

Figure 1: Distributions of winners in a series of 30 trades. The distribution is centered around a mean value of 18.
...Continued in the April 2002 issue of Technical Analysis of STOCKS & COMMODITIES
Excerpted from an article originally published in the April 2002 issue of Technical Analysis of STOCKS & COMMODITIES magazine. All rights reserved. © Copyright 2002, Technical Analysis, Inc.
Return to April 2002 Contents