April 2002
TRADERS' TIPS
You can copy these formulas and programs for easy use in your spreadsheet or analysis software. Simply "select" the desired text by highlighting as you would in any word processing program, then use your standard key command for copy or choose "copy" from the browser menu. The copied text can then be "pasted" into any open spreadsheet or other software by selecting an insertion point and executing a paste command. By toggling back and forth between an application window and the open Web page, data can be transferred with ease.
This month's tips include formulas and programs for:
TRADESTATION: Stop-and-reverse
TRADESTATION: Head and shoulders pattern
METASTOCK: Stop-and-reverse
METASTOCK: Head and shoulders pattern
NEUROSHELL TRADER: Head and shoulders
NEUROSHELL TRADER: Stop-and-reverse
WEALTH LAB: Head and shoulders
WEALTH LAB: Stop-and-reverse
INVESTOR/RT: Stop-and-reverse
NEOTICKER: Stop-and-reverse
TECHNIFILTER PLUS: Stop-and-reverse
or return to April 2002 Contents
![]() TRADESTATION: Stop-and-reverse
TRADESTATION: Stop-and-reverse
In his article "Stay In The Market With Stop-And-Reverse" in the Working Money section of this issue, Rudy Teseo appears to have based his discussion and illustration on the version of parabolic SAR included in SuperCharts, one of our legacy products. Our current software, TradeStation 6, includes a more powerful multiple-outputs version of the parabolicSar function, as well as several wrapper functions, indicators, and trading strategies based on this underlying function.
The inputs (and inputs-cum-outputs) section of the EasyLanguage code
for the multiple-output parabolicSAR function is reproduced here (the full
EasyLanguage code can be viewed in TradeStation 6):
inputs { and inputs-cum-outputs}:
 AfStep( numericsimple ),
  { acceleration factor step, generally set to 0.02 }
 AfLimit( numericsimple ),
  { acceleration factor limit, generally set to 0.2 }
 oParCl( numericref ),
  { final stop for today, diff from init stop on reversal days }
 oParOp( numericref ),
  { initial stop for tomorrow }
 oPosition( numericref ),
  { position at end of day, can be 1 or -1 }
 oTransition( numericref ) ;
  { reversal days return 1 or -1, holding days return 0 }
Parabolic wrapper functions included in TradeStation 6: Parabolic
(returns the oParCl output above) and ParabolicCustom (returns oParCl,
allows you to set AfStep & AfLimit)
Indicator included: Parabolic SAR (plots oParCl; includes alerts)
Strategies included: Parabolic LE (long entry), Parabolic SE (short entry); both based on oPosition output above.
Note on multiple-output and wrapper functions in TradeStation 6: A multiple-output function has two types of parameters or "inputs": input parameters and input/output parameters. The values of the input parameters are passed into the multiple-output function, but not modified by the function. The values of the input/output parameters are passed into the multiple-output function, modified by it, and the modified values are then inherited by -- or output to -- the calling routine.
The input/output parameters are often used for output purposes only -- that is, the incoming values are ignored. The outputs are in addition to the function return. In multiple-output functions, the function return is generally used to return an error code, though sometimes the return may simply be a dummy value.
The input/output parameters are declared with a "ref" suffix (such as "numericref") in the multiple-output function's declaration statements. For further clarity, the names of the input/output parameters are generally prefixed with an "o" in the function as well as in all the routines that call the function.
The built-in single-return wrapper functions that call the multiple-output functions are specialized calling routines designed to offer simplified, alternate pathways to the functionality of the underlying multiple-output functions. In the wrapper functions, the input/output parameters are declared as local variables and generally initialized to zero. They are passed through to the multiple-output function without further modification. After the call, the wrapper function picks out the single output of interest and assigns it as the return of the wrapper function.
--Ramesh Dhingra
Director, EasyLanguage Consulting
TradeStation Technologies, Inc.
(formerly Omega Research, Inc.)
a subsidiary of TradeStation Group, Inc.
www.TradeStation.com
![]() TRADESTATION: Head and shoulders pattern
TRADESTATION: Head and shoulders pattern
Martin Boot in this issue examines the head and shoulders pattern as an indicator for detecting trend changes. TradeStation includes a built-in head and shoulders "ShowMe" indicator. The ShowMe places markers on a price chart highlighting neckline breakouts. In addition, the ShowMe illustrates the neckline as a trendline segment, and also labels the head and the two shoulders individually. An optional volume confirmation label is also available.
(In TradeStation 6, the volume confirmation looks for volume to increase from the first to the second shoulder, as opposed to the decreasing volume that Boot specifies in his article. Since TradeStation makes all EasyLanguage code available to clients, this volume condition can easily be modified by a client if necessary.)
The inputs section of the EasyLanguage code for the TradeStation 6 ShowMe is reproduced here. Each of these inputs is user customizable at the time the ShowMe is applied to a chart, and the values listed are the default values. The inline documentation describing each input is included in the curly braces (some of which has been expanded for this column):
Inputs:
 NeckSwStrength( 2 ),
 HnSSwStrength( 2 ),
  { swing strength 2 specifies a 5 point swing,
  such as up-up-peak-down-down }
 VertProportionLimit( .33 ),
  { neckline tilt / max neck-to-head distance; if
  this ratio is too large, H&S pattern may be too
  lopsided to be valid }
 HiLo( 1 ),
  { pass in 1 for H&S Top, -1 for H&S Bottom }
 ConfirmVolume( true ),
  { if true, then vol confirm/non-confirm label will
  be added based on comparison of avg vol (fast)
  at end of second shoulder to avg vol (slow) at
  end of second shoulder and avg vol (slow) at end
  of first shoulder; vol confirm if vol fast
  higher in both cases }
 DrawNeckline( true ),
   { if this is "false", no neckline will be drawn
    and no ShowMe markers will be plotted; the H&S
    patterns will be identified by the "Head"
    and "Shoulder" text labels only }
 BarsPast( 10 ),
   { for a given H&S, a ShowMe is plotted only if
    the Close crosses the H&S neckline within
    BarsPast bars of H&S confirmation }
 Color1( Yellow ),
 Color2( Cyan ) ;
   { Color1 and Color2 are used in an alternating
    fashion each time a new H&S is found; for a
    given H&S, the text labels, volume message,
    neckline, and ShowMe marker are all drawn in the
    same color }
The full EasyLanguage code for the TradeStation head and shoulders
ShowMe indicator can be viewed in TradeStation. The indicator can easily
be converted into a trading strategy (or trading system) to conduct tests
like those described by Boot.
--Ramesh DhingraGO BACK
Director, EasyLanguage Consulting
TradeStation Technologies, Inc.
(formerly Omega Research, Inc.)
a subsidiary of TradeStation Group, Inc.
https://www.TradeStation.com
![]() METASTOCK: Stop-and-reverse
METASTOCK: Stop-and-reverse
The parabolic SAR indicator discussed by Rudy Teseo already exists in MetaStock 6.52 or higher. Simply pull down the indicator quicklist and drop the indicator onto the chart or display it in its own window.
--Scott Brown, Equis International, Inc.
www.equis.com
![]() METASTOCK: Head and shoulders pattern
METASTOCK: Head and shoulders pattern
Martin Boot discusses head and shoulders patterns in this issue. To help locate a head and shoulders pattern on a MetaStock chart, you can use the Chart Pattern Recognition plug-in, which was developed by John Murphy. Chart Pattern Recognition looks for nine different chart patterns, one of which is head and shoulders. For more information about the Chart Pattern Recognition plug-in for MetaStock, please call Equis International at 800 882-3040. [Editor's note: Chart Pattern Recognition was reviewed in the February 2002 STOCKS & COMMODITIES.]
--Scott Brown, Equis International, Inc.
www.equis.com
![]() NEUROSHELL TRADER: Head and shoulders
NEUROSHELL TRADER: Head and shoulders
The head and shoulders pattern discussed in Martin Boot's article in this issue, "Does The Head & Shoulders Formation Work?," can be easily implemented in NeuroShell Trader by combining a few of the more than 800 built-in indicators and the ZigZag indicator on which it is based.
The ZigZag indicator is found in the Advanced Indicator Set add-on (available for purchase). We've combined the indicators for you and have created custom indicators that you can download from the NeuroShell Trader free technical support website. The custom indicators include the Right Shoulder, Head, Left Shoulder, Neckline and Current Slope from Right Shoulder.
After downloading the custom indicators, you can easily insert them into a chart as follows:
1. Select "New Indicator ..." from the Insert menu.
2. Select the Custom Indicator category.
3. Select the indicator(s) of interest.
4. Change parameters if necessary and press Finish.
The two conditions described in the article to identify a head and
shoulders pattern can be set up by creating the following indicators (Figure
1):
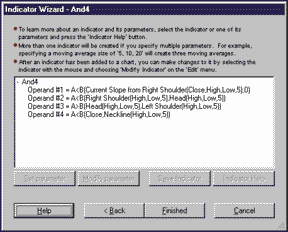
Figure 1: NeuroShell Trader, Head and shoulders. Use the Indicator Wizard in NeuroShell Trader to set up the conditions for finding head and shoulders patterns.
Condition 1: Determines whether the current slope is negative and
whether a head and shoulders pattern exists (that is, whether the second
peak is higher than the first and third peaks):
Condition 2: Determines that a head and shoulders pattern exists and that the neckline is broken:AND3 ( A<B(CurrentSlopefromRightShoulder(...), 0), A<B ( RightShoulder(...), Head(...), A>B( Head(...), LeftShoulder(...) )
AND4 ( A<B(CurrentSlopefromRightShoulder(...), 0),
 A< (RightShoulder(...),Head(...), A>B(Head(...),LeftShoulder(...),
 A<B (NeckLine(...),Close) )
Please note that the head and shoulders pattern is based on the
ZigZag indicator. Because the ZigZag indicator identifies peaks and valleys
by looking at future data values, the ZigZag indicator cannot be used in
a NeuroShell Trading Strategy for trading into the future and should only
be used for backtesting. For this same reason, the head and shoulders indicator
should only be used in a trading strategy for backtesting on past data.
Owners of our Fuzzy Pattern Recognizer add-on may want to experiment using fuzzy logic to find similar patterns.
Users of NeuroShell Trader can go to the STOCKS & COMMODITIES section of the NeuroShell Trader free technical support website to download a sample head and shoulders chart, which includes all of the custom indicators described here (Figure 2).
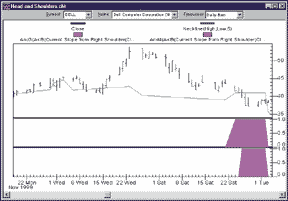
Figure 2: NeuroShell Trader, Head and shoulders. This NeuroShell Trader chart shows the head and shoulders conditions and neckline indicator.
For more information on NeuroShell Trader, visit www.NeuroShell.com.
--Marge Sherald, Ward Systems Group, Inc.
301 662-7950, sales@wardsystems.com
www.neuroshell.com
![]() NEUROSHELL TRADER: Stop-and-reverse
NEUROSHELL TRADER: Stop-and-reverse
The parabolic SAR discussed in "Stay In The Market With Stop-And-Reverse" by Rudy Teseo in this issue can be easily implemented in NeuroShell Trader by using NeuroShell Trader's ability to call programmed functions you code. This code can be written in C, C++, Power Basic, or Delphi.
We've created the Parabolic SAR Long and Parabolic SAR Short indicators that you can download from NeuroShell Trader's free technical support website.
After downloading the custom indicator, you can easily create a NeuroShell trading strategy that uses parabolic trailing stops. To do so, select "New Trading Strategy ..." from the Insert menu and set up the trading strategy as follows:
Long Trailing Stop:
 Parabolic SAR Long (Trading Strategy, High, Low, 0.02)
Short Trailing Stop:
 Parabolic SAR Short (Trading Strategy, High, Low, 0.02)
Note that the parabolic SAR custom indicators are found in the Custom
Indicators indicator category. If you wish to change to a different acceleration
factor, simply use a value other than the default, 0.02.
If you have NeuroShell Trader Professional, you can also choose whether the acceleration factor should be optimized. After backtesting the trading strategy, use the "Detailed Analysis ..." button to view the backtest and trade-by-trade statistics for the parabolic SAR system.
Users of NeuroShell Trader can go to the STOCKS & COMMODITIES section of the NeuroShell Trader free technical support website to download the ParabolicSAR Dll and a sample ParabolicSAR chart, which has the parabolic custom indicators and the parabolic trading strategy described above.
--Marge Sherald, Ward Systems Group, Inc.
301 662-7950, sales@wardsystems.com
https://www.neuroshell.com
Our WealthScript scripting language is perfect for coding complex studies such as the head and shoulders top pattern. The script presented here searches for head and shoulders top patterns in your charts, but then goes one step further and draws custom annotations that show you exactly how the patterns unfold.
The script colors the peak bars blue and the trough bars red (Figure 4). It also labels the head and shoulder bars. It draws the head and shoulders neckline when a penetration has occurred. It also calculates and plots the downward price objective of the pattern, and identifies the bar at which the objective was met by coloring it bluish green.
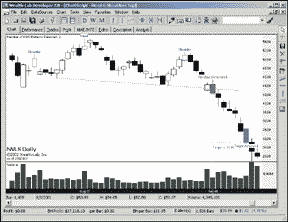
Figure 4: Wealth-Lab, head and shoulders. Here's a sample display of the head and shoulders pattern in Wealth-Lab.
The script also provides you with a number of parameter values that
you can experiment with to manipulate the sensitivity of the algorithm.
The "Reversal" variable determines the percentage move required
to identify new peaks and troughs (5% is the default). The "HeadHeightPct"
variable controls the minimum height above the shoulders that the head
must exhibit. "ShoulderSymmetry" controls how closely the
height of the two shoulders must be to each other for a valid pattern.
Our implementation also incorporates a critical criterion of the head and shoulders pattern that was not mentioned in the article. That is, a head and shoulders top must have a price advance to reverse. We verify this by checking the 100-bar rate of change (Roc).
There's plenty of room for tweaking in this script, and it is meant to be a starting point only. One interesting modification would be to dynamically set the reversal rate required to detect peaks and troughs. Different markets exhibit different volatility characteristics. This leads to each market having its own ideal reversal value. If one could dynamically determine the optimal reversal percentage, more accurate pattern identification could occur.
You can use this script in our Wealth-Lab Developer 2.0 product, or run it on our website, www.wealth-lab.com. Just click the ChartScript menu, and then search for a ChartScript named "Head & shoulders top."
var Neckline, P0, T0, P1, T1, P2, pct, diff, target: float;
var FoundHS: boolean;
var Reversal, HeadHeightPct, ShoulderSymmetry, NumHS, Bar, TB1, TB0, PB0,
PB1, PB2: integer;
var TargetBar, BarsExpire, HSBar, DetectedPB: integer;
{ Change these settings to affect the H&S detection }Reversal := 5; HeadHeightPct := 1; ShoulderSymmetry := 2; BarsExpire := 40; FoundHS := false; NumHS := 0; DetectedPB := 0; for Bar := 20 to BarCount - 1 dobegin { Are we currently processing a H&S that we found earlier? } if FoundHS then begin { Project the neckline to the current bar } neckline := LineExtendY( tb1, t1, tb0, t0, Bar ); if PriceClose( Bar ) < neckline then { Neckline penetration } begin SetBarColor( Bar, #Green ); AnnotateBar( 'Neckline Penetrated', Bar, true, #Green, 8 ); FoundHS := false; { Calculate and plot the downward target objective } diff := p1 - neckline; target := neckline - diff; if target > 0 then begin for TargetBar := Bar to BarCount - 2 do if PriceLow( TargetBar ) <= target then Break; DrawLine( Bar, target, TargetBar, target, 0, #Teal, #Dotted ); AnnotateChart( 'Target = ' + FormatFloat( '#0.00', target ), 0, Bar, target * 0.98, #Teal, 8 ); if PriceLow( TargetBar ) < target then begin SetBarColor( TargetBar, #Teal ); AnnotateBar( 'Target Achieved', TargetBar, false, #Teal, 8 ); end; end; { Draw the neckline, extend out 5 bars for clarity } neckline := LineExtendY( tb1, t1, tb0, t0, Bar + 5 ); DrawLine( tb1, t1, Bar + 5, neckline, 0, #Green, #Dotted ); end else { Expire patterns that don't have penetration after a certain number of bars } begin if Bar - HSBar > BarsExpire then FoundHS := false; end; end elsebegin{ Determine locations and values of most recent peaks and troughs } p0 := Peak( Bar, #High, Reversal ); pb0 := PeakBar( Bar, #High, Reversal ); t0 := Trough( pb0, #Low, Reversal ); tb0 := TroughBar( pb0, #Low, Reversal ); p1 := Peak( tb0, #High, Reversal ); pb1 := PeakBar( tb0, #High, Reversal ); t1 := Trough( pb1, #Low, Reversal ); tb1 := TroughBar( pb1, #Low, Reversal ); p2 := Peak( tb1, #High, Reversal ); pb2 := PeakBar( tb1, #High, Reversal );{ Is the head higher than the two shoulders? } if ( p1 > p0 ) and ( p1 > p2 ) then begin pct := ( ( p1 - p0 ) / p0 ) * 100; if pct >= HeadHeightPct then begin pct := ( ( p1 - p2 ) / p2 ) * 100; if pct >= HeadHeightPct then{ Check the symmetry of the soulders } begin pct := ( Abs( p2 - p0 ) / p2 ) * 100; if pct <= ShoulderSymmetry then{ The H&S top must have a price advance to reverse } if ROC( pb1, #Close, 100 ) > 15 then{ Make sure we don't detect the same H&S twice in a row } if pb2 <> DetectedPB then{ H&S Found, mark it on the Chart } begin FoundHS := true; HSBar := Bar; DetectedPB := pb2; Inc( NumHS ); SetBarColor( pb0, #Blue ); SetBarColor( pb1, #Blue ); SetBarColor( pb2, #Blue ); SetBarColor( tb0, #Red ); SetBarColor( tb1, #Red ); AnnotateBar( 'Shoulder', pb0, true, #Blue, 8 ); AnnotateBar( 'Head', pb1, true, #Blue, 8 ); AnnotateBar( 'Shoulder', pb2, true, #Blue, 8 ); end; end; end; end; end; end;DrawLabel( 'Number of H&S Patterns Detected: ' + IntToStr( NumHS ), 0 );--Dion Kurczek, Wealth-Lab.com
www.wealth-lab.com
![]() Wealth-Lab: Stop-and-reverse
Wealth-Lab: Stop-and-reverse
The parabolic Sar discussed by Rudy Teseo in the Working Money section of this issue is a native indicator in Wealth-Lab Developer 2.0. The Wealth-Lab site (www.wealth-lab.com) has a number of scripts based on parabolic Sar that you can try out on any US stock. Click the ChartScripts main menu item, then select the ChartScript search option. Perform a title search using the keyword parabolic. At the time of this writing, six scripts were returned.
The parabolic indicator script shows how to perform the standard stop and reverse system based on the parabolic. This system works especially well for markets that tend to trend strongly. In Figure 5, you can see that the parabolic system generated increasing profits in Ariba [Arba] as the price suffered a substantial decline.
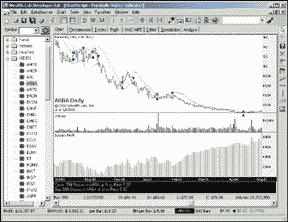
Figure 5: Wealth-Lab, Parabolic stop-and-reverse. The parabolic indicator Wealth-Lab script shows how to perform the standard stop and reverse system based on parabolic. The system works well for markets that trend strongly. Here, you can see that the parabolic system generated increasing profits in Ariba [Arba] as the price suffered a substantial decline.
The parabolic trailing stop demo (Figure 6) is an interesting script
that was submitted by a Wealth-Lab user. It combines the parabolic with
some of the Mesa techniques that have been published by John Ehlers. The
system enters the market when the Mesa following moving average (FAMA)
crosses above the Mesa adaptive moving average (MAMA). But, instead of
waiting for FAMA to cross back below MAMA, it uses the parabolic as a trailing
stop. This usually saves us from losing some profits waiting for the crossover
to occur.
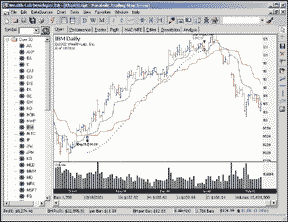
Figure 6: Wealth-Lab, parabolic trailing stop. The parabolic trailing stop demo combines the parabolic SAR with Mesa techniques developed by John Ehlers.
--Dion Kurczek, Wealth-Lab.com
www.wealth-lab.com
![]() Investor/RT: Stop-and-reverse
Investor/RT: Stop-and-reverse
The parabolic stop-and-reverse (SAR) discussed in the Working Money section of this issue by Rudy Teseo is a built-in indicator in Investor/RT. Using this indicator on multi-periodicity charts in conjunction with a customized Sar oscillator can provide clear comparison of entry and exit points over multiple timeframes.
The chart in Figure 7 requires some explanation. In the top pane, three-minute
candles of MSFT are seen in green and red, while a blue line connects the
15-minute closing prices. Investor/RT allows as many timeframes to be charted
in the same window, in candle, line, bar, or histogram form, and each indicator
can be associated with any timeframe. In addition, multiple symbols can
be charted within the same window. The upper pane also contains the SAR
indicator. The blue dots represent the 15-minute SAR, while the smaller
red dots represent the three-minute SAR. The lower pane shows a histogram
of the SAR oscillator (three-minute in red, 15-minute in blue).
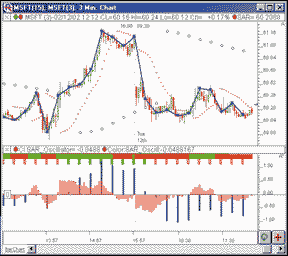
Figure 7: Investor/RT, stop-and-reverse. Here is a sample three- and 15-minute multi-periodicity chart showing SAR, SAR oscillator, and color markers.
The SAR oscillator is a custom indicator representing the difference
between the closing price (CL) and the Sar value, computed using the following
syntax:
CL - SAR
This value will be positive when SAR is in a long state, and negative
when SAR is in a short state. The oscillator is drawn as a histogram that
oscillates about zero. According to Teseo, a long position should be initiated
when the histogram crosses above the zero line, and a short position should
be initiated when the line falls below the zero line.
Color markers are also added to the lower pane. These provide an optional method for signaling reversals. The markers are green when the Sar is long, and red when the SAR is short. The three-minute markers are displayed on top of the 15-minute markers, both using the same color scheme.
The preferences for the Investor/RT implementation of the parabolic
SAR can be seen in Figure 8.
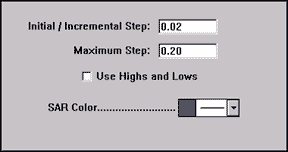
Figure 8: Investor/RT, stop-and-reverse. Here are the suggested preferences for the parabolic SAR.
The initial/incremental step is equivalent to what is referred to
as the acceleration factor (AF) in the Teseo article. This represents both
the initial step value and the amount by which the SAR value will be stepped
when necessary. The "maximum step" field puts an upper limit
on the amount that can be stepped from bar to bar. The "Use highs
and lows" option computes the SAR value using the extreme values
of the bar (highs and lows) as opposed to simply the closing price. The
color controls provide control over the size and color of your SAR dots.
--Chad Payne, Linn Software
800-546-6842, info@linnsoft.com
www.linnsoft.com
![]() NeoTicker: Stop-and-reverse
NeoTicker: Stop-and-reverse
NeoTicker has the parabolic SAR indicator built-in. To add the indicator to any NeoTicker chart, simply choose "add indicator" from the right-click popup menu, then select parabolic SAR. Figure 9 is the parabolic SAR applied to Dow Jones daily data.
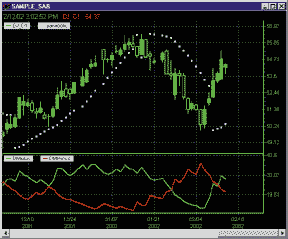
Figure 9: NeoTicker, stop-and-reverse. Here's the parabolic SAR displayed on a NeoTicker chart. The SAR is a built-in indicator in NeoTicker.
--Lawrence Chan, TickQuest Inc.
www.tickquest.com
![]() TECHNIFILTER PLUS: Stop-and-reverse
TECHNIFILTER PLUS: Stop-and-reverse
TechniFilter Plus ships with the parabolic SAR formula as part of its library. The first two parameters in SAR(INITIAL,LIMIT, SWITCH) refer to the initial value of AF and the limit value of AF. The default values are 0.02 and 0.2, respectively.
The third parameter, switch, is an integer 1 through 6. Its value tells TechniFilter Plus what information you want to use and what results you want to get. So SAR(INITIAL,LIMIT, SWITCH) is really six formulas, depending on the value of switch.
Switch 1: Uses highs and lows to compute SAR. It returns today's value of SAR. Use it when you want to see today's stop today; that is, when you want to view a bar chart with Sar overlaid as shown in the illustration below. You see the reversals when the bars penetrate the stops. For a visual comparison, today's stops must match today's bars.Switch 2: Uses highs and lows to compute Sar. It returns tomorrow's value of SAR. Use it when you want to see tomorrow's stop today, which means that you are ready to trade this system. You need to know tomorrow's stop price so you can call your broker and place an appropriate order. To get stop prices to place your orders, include the SAR formula in a filter report with the last switch digit set to 2.
Switch 3: Uses highs and lows to compute SAR. It returns 1 if today is a SAR reversal from a short position to a long position; -1 if today is a SAR reversal from a long position to a short position; and zero for no reversal. It will mark the days that you have reversals, either +1 or -1, making it easy to design a strategy that trades the SAR system.
Switch 4: Uses only closes to compute SAR. It returns today's value of SAR. Acts like switch 1.
Switch 5: Uses only closes to compute SAR. It returns tomorrow's value of SAR. Acts like switch 2.
Switch 6: Uses only closes to compute SAR. It returns 1 if today is an SAR reversal from a short position to a long position; -1 if today is a SAR reversal from a long position to a short position; and zero for no reversal. Acts like switch 3.
An alternative formula is: SAR (INITIAL,LIMIT,INCREMENT,SWITCH).
In this version, the acceleration factor is incremented by the parameter
increment instead of the parameter initial.
Visit RTR's website at www.rtrsoftware.com to download Traders' Tips and program updates.
--Clay Burch, RTR Software
919 510-0608, rtrsoft@aol.com
www.rtrsoftware.com
All rights reserved. © Copyright 2002, Technical Analysis, Inc.
Return to April 2002 Contents