Access to foreign exchange trading has opened up exciting trading options for the retail trader. You can now trade alongside corporations and institutions in a highly liquid market that is global, traded around the clock, and highly leveraged. Before jumping into this market, however, we must understand the factors that affect the forex market. With that in mind, STOCKS & COMMODITIES has introduced Forex Focus to better prepare the retail trader to participate in the currency market.
PLAYING THE INFLATION GAME
Is inflation a threat? Find the answer by looking at the historical performance of commodity prices, the US dollar, gold, and economic conditions.
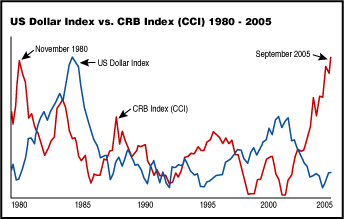
On New Year's Eve 2004, the US Dollar Index hit a nine-year low of 80.53, a level of dollar weakness that had been seen only twice before in the past 30 years. Two months later, the Commodity Research Bureau Index (CRB) hit new multiyear highs and continued to move up from there. The basket of commodities and the dollar had been at simultaneous, opposite extremes only once before in recent memory, and that was in November 1980.
While the US Dollar Index recovered going into 2005, commodity prices continued to rise. The CRB (recently renamed the Continuous Commodity Index) hit 336.56 on September 1, just short of the all-time high of 337.60 hit on November 20, 1980. In September 2005, gold was hovering around a 17-year high. (See Figure 1.)
During both periods, gold and oil prices were also at or near either all-time or multiyear highs. But there was one pivotal difference: the federal funds rate was 3.75% this time around, while the last time the dollar and commodity prices were at opposite ends of the scale (in 1980), it was approaching 20%.
Given the number of similarities between the late 1970s and recent times, can understanding what happened to the markets after 1980 help us anticipate what to expect today? And if so, what impact will dramatically lower interest rates today have on commodities and gold prices going forward? In the current volatile markets, what is the best way to play the inflation game?

FIGURE 1: Monthly chart showing the CRB (CCI) Index and US Dollar Index between 1979 and 2005. See two periods when the US dollar and the CRB were at opposite extremes. September 2005 also marked a 25-year high for the CRB.
Return to February 2006 Contents
Originally published in the February 2006 issue of Technical Analysis
of STOCKS & COMMODITIES magazine. All rights reserved. © Copyright 2006, Technical Analysis, Inc.