Access to foreign exchange trading has opened up exciting trading options for the retail trader. You can now trade alongside corporations and institutions in a highly liquid market that is global, traded around the clock, and highly leveraged. Before jumping into this market, however, we must understand the factors that affect the forex market. With that in mind, STOCKS & COMMODITIES has introduced Forex Focus to better prepare the retail trader to participate in the currency market.
Going Beyond 70 And 30 In Forex
Here's a look at the performance of a foreign exchange strategy that was applied to the EUR/USD.
by Jamie Saettele
The relative strength index (RSI), developed by J. Welles Wilder, is one of the most widely used indicators in technical analysis. But by the same token, it is also one of the most misunderstood and incorrectly applied indicators in technical analysis. Too often, a trader attempts to pick a top or a bottom and then watches in frustration as the market fails to top out or bottom out and continues to move in the same direction. Most traders realize that RSI is an oscillator and that its value can range anywhere from zero to 100. Extreme readings are said to be over the 70 level and below the 30 mark, with the former considered overbought and the latter oversold.
CATCHING A MOVE
This is where most mistakes are made. Novice and experienced traders alike jump at the opportunity to sell a cross below 70 or buy a cross above 30, trying to pick a top or a bottom. Some of the trades will surely work out, but it is the one or two losses that occur when the trader finds him- or herself on the wrong side of a strong trending market that will wreak havoc. It is not necessary to sell tops and buy bottoms. Instead, it's more effective to try to catch portions of large moves with higher-probability entry points.
Further, markets do not move straight up and straight down. Markets zigzag up, down, or sideways. This means that an RSI cross below 70 could be a correction within a broader trend, and that the correct move would be to buy strength, not sell it. Strong market moves will cause RSI to fluctuate near its extreme levels of 70 and 30, resulting in many crosses below 70 and above 30 and consequently many false signals.
It is during these strong moves that a participating, savvy trader profits. To be sure, money is made in ranging markets, but it can be made, and lost, much faster during trending markets. Most traders and analysts dismiss RSI during trending markets, claiming that the indicator is most useful during range-bound markets. However, RSI can be used in all market conditions if used wisely.
THE STRATEGY
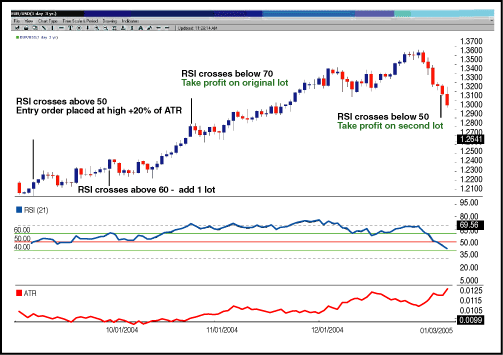
We have established that an RSI reading above 70 occurs after a strong move upward and that an RSI reading below 30 occurs after a strong move downward. Before getting to 70 or 30, RSI had to cross 50 and 60 on its way up as well as 50, and then 40, on its way down. This is the logic on which we will base our strategy.
We will call upon the average true range (ATR) to aid in objectivity when entering and placing stops. ATR measures the average range per bar (or candlestick) over a specified number of periods. We are making our entry order and stop order dynamic by using percentages of ATR to place orders. As market volatility changes, so too do our orders. This ensures that we are implementing a wider stop in more volatile markets, which is necessary in order to give your trade more room to work.

FIGURE 1: EUR/USD. Applying the strategy on the daily chart of the EUR/USD generated a 554-pip profit for the first lot and a 736-pip profit for the second lot.
Return to August 2006 Contents
Originally published in the August 2006 issue of Technical Analysis
of STOCKS & COMMODITIES magazine. All rights reserved.
© Copyright 2006, Technical Analysis, Inc.