NEW TECHNIQUES
Applying Hysteresis To Moving Averages
Join The Band
Apply this method to moving average crossovers to get rid of the lag and the false signals.
One of the first indicators that any technical analysis novice studies is the moving average crossover. Moving averages (MAs) smooth a price series by determining the average closing price for a determined period (the last n bars) and, as a result, are lagging indicators, more suited to trending markets rather than rangebound ones.
If two MAs of different periods are used together, a simple trading system can be built around it easily. Every time the shorter (faster) moving average crosses above the longer (slower) one, a buy signal is generated; a sell signal is produced when the faster average crosses below the slower one.
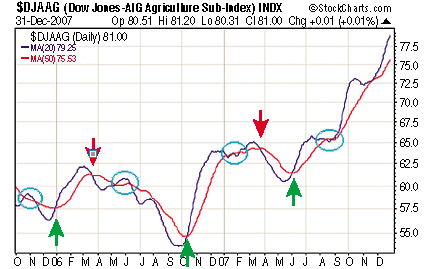
As any technical analyst knows, these crossovers are prone to whipsaws; the price moves just enough in one direction to trigger a signal, then quickly changes direction, triggering an opposite signal. This causes early entries and exits that jeopardize trade performance (Figure 1).

FIGURE 1: WHIPSAWS. The arrows indicate clear signals, while the circles point to whipsaws. Note that, for the purpose of clarity, price bars were removed and only the SMA lines were plotted.
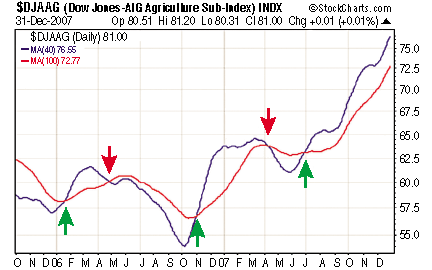
Whipsaws are the result of the sensitivity of MAs to data fluctuations. The classical approach to this problem has been to increase the averaging period (Figure 2) at a cost of increased lag, which, if too pronounced, may render the indicator useless.

FIGURE 2: SLOWING DOWN. Observe how whipsaws were prevented by increasing the periods used by the moving averages, but also note the delay of at least one month in the signals.
In addition, whipsaws tend to affect different time frames in a similar manner. For example, a set of two MAs on a daily chart will probably incur a similar frequency of false signals during the course of seven months (154 bars) as an equally parameterized set of MAs will sustain on a three-year weekly chart (3 * 52 = 156 bars). The annoyance frequency just moves to a larger time frame.
So the problem lies in the concept: simple line crossovers must be replaced as signal generators by a different kind of triggering system.
If we were to draw charts by hand (the only option before the computer age), we would find the idea of a thick-lined pencil a useful one, as it would allow for some breadth where the averages intersect. But line thickness is, mathematically speaking, an absurdity. What we need is a band or an envelope around the slower MA, within which the indicator can jitter around without causing false signals.
Before we develop this idea any further, let us enter the world of engineering and get acquainted with a crucial notion in control systems.
Hysteresis
First as an engineering student and later working in the food industry, I was introduced to the area of control systems and to the problem of repeated activation-deactivation cycles. Take, for example, a thermostat controlling a cooling system like the one you will find in your refrigerator. We want it to keep the temperature as constant as possible, say five degrees Centigrade (5ūC) (T0), and the cooling system can only be in one of two states: off or on. If the thermostat reacted immediately to any difference from T0, it would activate or deactivate the system with a frequency that would cause stress to the equipment and cooling inefficiency.