INDICATORS
Which System = Higher Return?
The Megan Ratio
Which system will generate more return? Here’s a metric that will help you answer that question.
Many metrics can evaluate the performance of trading systems. These include net profit, recovery factor, Sharpe ratio, K-ratio, and risk-adjusted return. Even though you can use these metrics to select the best trading system for you, the criteria for selecting a system tend to be arbitrary. Metrics such as the Sharpe ratio or K-ratio give an indication about the slope and smoothness of the equity curve but don’t indicate which system is the best in terms of monetary performance.
Not only that, keep in mind that the system with the best net profit after simulation is not necessarily the one that will generate a higher return when you actually trade it. Another system with fewer trades in the simulation but better statistics could produce more trades and superior performance. Real trading results will differ from simulated trades because different systems have different holding periods for trades. Those systems that generate more trades in the same period should do better (if the rest stays the same).
The Megan ratio, which stands for the maximum exponential growth annualized of the equity curve of a trading system, is a metric specifically designed to highlight the system that generates more returns per year when the profits are reinvested, regardless of the number of trades, holding period, drawdown, and so on. This is especially useful to determine whether a specific filter, which eliminates trades and therefore profits, is beneficial to the performance of the system.
The geometric mean
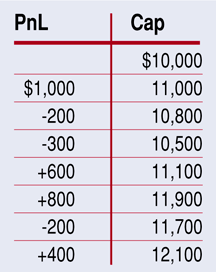
In terms of absolute return, the best system is the one with the best geometric mean. This is because we want to reinvest the profits in the next trade. The arithmetic average does not take into account the reinvestment of profits. For example, imagine the following set of seven trades with a starting capital of $10,000:

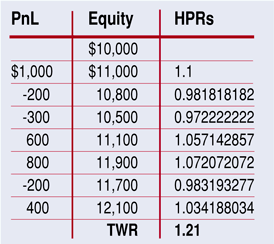
The final equity is $12,100 after a $2,100 gain. We can express each profit & loss as a percentage of the capital available before the trade. We see this in the third column:

A holding period return (Hpr) of 1.1 is a 10% gain and an Hpr of 0.9818 is a 1 - 0.9818 = 1.82% loss. If you multiply the Hpr, you get the terminal wealth relative (Twr), a multiplicative factor (see Ralph Vince’s work). In this case, it is 1.21. This factor is the quotient between final and initial capital. This is the number we multiply the initial account by at the end of the sequence of trades.
The geometric mean is obtained by taking the nth root of the Twr. N accounts for the number of trades. In this case, we are going to do the seventh root of 1.21 -> 1.21^(1/7) = 1.0276, or a geometric mean of 2.76%.
This percentage is important, since it is the number to multiply each trade by on average. If there are seven trades with a geometric mean of 2.76%, you can expect the final equity to be multiplied by 1.0276^7 = 1.21, or a 21% gain.
Note that the average mean is not the number we are looking for. In the previous sequence of trades, the average mean is 2.87%. After seven trades with such an average, you would expect a multiplicative factor of 1.2187, which exceeds the real gain. This is a common mistake. The average mean does not take into account the reinvestment of profits.
The Megan ratio
Say you have two different systems to trade. System 1 has a geometric mean of 3% and holds positions for an average of three days. System 2 has a geometric mean of 4% and holds positions for four days. Which is better for real trading? The Megan ratio will give you the answer.