![]()
eMiniZ.com
Back in September 2006, we reviewed www.eminiz.com, a website developed by John F. Ehlers. Since then there have been several additions and enhancements that make it worth looking at again.
When you visit the site, the first thing that will catch your eye are four gauges. For those of you who are familiar with John Ehlers’s work on corona charts (an article on the subject was published in the November 2008 issue of S&C) will recognize the terms such as cycle period, cycle swing position, cycle S/N ratio, and the adaptive trend vigor. If you’re not familiar with corona charts, the details about what the gauges indicate are displayed prominently on the home page, and you also have access to other features that will help you understand them better. You can also download EasyLanguage indicator code for corona charts.
Features
This site provides trading signals for five mini index futures, namely the emini, Nasdaq 100 index, emini Russell 2000 index, emini Dow 30 index, and the emini S&P MidCap index. From the dropdown menu you can select the index you are interested in.
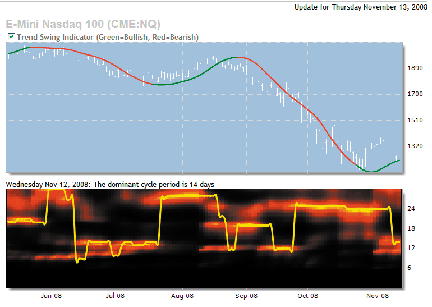
Going back to the gauges, if you want to find out more about them, try clicking on the “Corona charts” part of the menu to the left of the gauges. From there you can select the topic of your interest. Select the dominant cycle period and select the emini Nasdaq 100 index. What you will see is a price chart with the trend swing indicator overlaid as well as the corona chart that reflects the dominant cycle period (Figure 1). You can do the same for the cycle swing position, cycle signal/noise ratio, or the adaptive trend vigor, or you can look at them together to determine where prices are relative to the cycle. This, of course, will help make your trading decisions.

FIGURE 1: dominant cycle period. Here you see a price chart with the trend swing indicator overlaid. The corona chart is displayed in the subchart displaying the dominant cycle.
The objective of eminiz.com is to predict short-term swings in the five indexes I mentioned earlier. It does this through proprietary computer algorithms. I would like to mention here that even though it is proprietary, you get an overview of what’s behind this advanced software architecture. There is, on the website, a description of the eight trading systems designed by John Ehlers. Being familiar with Ehlers’s work, I know it is very “techy.” The software was developed by eMiniz cofounder Ric Way, another great technical mind. There is a technical paper you can download that includes a discussion of the technology behind eMiniz.
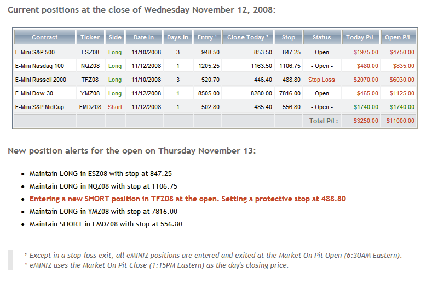
To truly understand how sophisticated this system is, all you have to do is look at the daily updates and the performance results. Those who are not subscribers will get an idea of what this site offers by viewing the 30-day delayed alerts and updates. But subscribers will receive end-of-day updates after the markets close as well as alerts for the next day’s open (Figure 2). In addition to the daily alerts, you can also see the details of each trade along with performance charts. One feature I liked about the performance bar charts was that if you hover your mouse over a bar, you will see the details of that specific trade.

FIGURE 2: updates and alerts. This is an example of what you can expect to get at the end of every trading day. You see the current positions as of the close of the trading day as well as alerts for the next day’s open.
Other features include performance reports, equity growth charts, profit trail charts, and monthly profit/loss charts. One feature I would like to emphasize here is the Monte Carlo simulation. This gives you, in addition to a realistic look at the performance of the system, an idea of how much thought and work went into developing the system. What sets eMiniz apart from any other trading system, besides the fact that it was created by two great technical minds, is that it reevaluates multiple trading strategies over multiple time frames and selects the optimal strategy based on out-of-sample performance. This avoids having to rely on backtested results.
There is also a very active user forum where you can get any questions answered about the product. I found some interesting discussions on some of the methods used to develop the eMiniz system.
What does it cost to subscribe to this service? The rates vary, depending on how many indexes you wish to receive alerts and updates for and whether you wish to pay monthly or every four months. The rates are clearly displayed on the website and you will find the range anywhere from less than $100 to less than $200 per month.
This is a site worth a visit regardless of where you are on the technical analysis curve. Beginners will get an idea of where they should be heading, and more advanced technical analysts will find the highly technical aspect impressive.
As far as the site design goes, I thought it was easy to navigate, and the displays were simple, clear, and straightforward. I thought it was a very effective way to communicate something that is difficult and complicated.
—Jayanthi Gopalakrishnan, Editor