DAYTRADING
Getting Long-Term Profits
Short-Term Trend Trading
This basic system can be traded profitably on a short-term basis.
Some of the most basic systems can be the most effective means of making money in the futures markets. In this article I will demonstrate one of the simple systems that can be traded successfully on a daily basis. There are no complex calculations to determine entry and exit points nor indicator crossovers to determine entry and exit points. If you can add two numbers and then divide them by 2, you can do the most difficult calculation involved in this system. All this system does is some near-term price comparison, placing a stop order to keep losses in control and determining the time to exit the trade with your (hopefully) profit or loss.
My trading day
The basic philosophy behind this system is to latch onto a trend that is in place based on the first half or so of a trading day. As many markets have gone to 24 hours a day, it’s difficult to determine exactly what entails a day of trading. I like to divide things by who is awake and trading at any given time, at least those of us who live normal lives and don’t live in Chicago and trade Tokyo hours. And because I live in Chicago, I usually designate 6:00 am Central Time (CT) to 3:00 pm CT as my trading day.
Before getting into what is involved in this system, I want to point out how little time it takes to trade on a daily basis. Basically, no more than 10 minutes a day should be spent on the setup and exit of the system. One of the benefits is that you can set it up during a midmorning coffee break and exit just as you get back from lunch. If the system works as it has in the past, and as always, past performance is not indicative of future returns, it’s not a bad payoff for 10 minutes of work each day.
The system
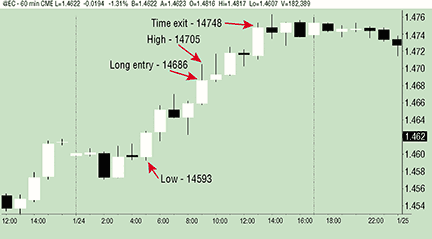
After selecting the time of the day, I compare the closing price to the high and low looking back over a certain time period. For example, this system can be used on the euro forex futures (EC). At 9:00 am CT (all times are CT from here on out), I compare the 60-minute bar close to high and low of the previous five bars. I look at the high–low range from 4:00 am to 9:00 am. Then I take the midpoint of this range and compare it to the closing price of the 9:00 am bar. If the close is greater than the midpoint you should go long, and if the close is lower than the midpoint you should go short. In the rare case the midpoint is equal to the close, you call it a day and don’t put on a trade. For charting purposes I use a 60-minute chart to determine the levels as well as the closing price. The chart examples in this article are 60-minute candlestick charts.

Figure 1: catching a trend and riding it. Here, you see the high and low that determine the signal level. Taking the average of the high–low range gives you the midpoint signal level. In this case the close is above this level, so you would go long.
After entry, I place a stop 20 ticks away from the entry point or on short positions 20 ticks higher and on longs 20 ticks lower. For those not familiar with the euro forex futures, each tick is equal to $12.50. In the case of the 20-tick stop, this should limit your loss to $250 per trade. Stops are not perfect, but as the EC futures are very liquid, a small-lot trader, trading no more than a few contracts, should not experience too much slippage when using a stop market order. This stop level on the euro FX trading is a combination of what I consider a reasonable amount of money to risk losing on the trade and what has worked well with backtesting. You would also need to determine what works for you as far as stops go.