Novice Traders’ Notebook
Cardinal Reversal Patterns — At Bottoms
6. The Broadening Bottom
The broadening bottom is virtually the same as the broadening top, except it is reversed. Like the broadening top, the broadening bottom forms a symmetrical triangle. Although the broadening top is a rare formation, the broadening bottom is even rarer.

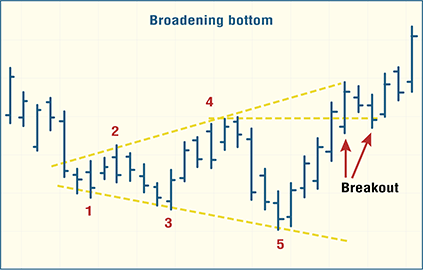
FIGURE 1: BROADENING BOTTOM. Here, we see the characteristic pattern of the broadening bottom. This rare formation can be recognized by the successively higher highs and lower lows, which form after a downward move. Usually, two higher highs between three lower lows form the pattern, which is completed when prices break above the second higher high and do not fall below it.
The figure above shows a typical broadening bottom with three successively lower lows and two successively higher highs that combine at the end of a downward move. This gives the impression of an erratic market, as the swings in both directions get wider each time. The pattern is completed when, usually on the third upswing within the pattern, prices break above the prior high but fail to fall below this level again.
The broadening bottom may form less frequently than the top because the pattern reflects a market moved by an emotionally volatile public, perhaps reacting to rumors more than technical or fundamental reasoning. This occurs more often during manic tops found at the end of sustained bull moves rather than at the end of a bear market. The sustained bear market will slowly end by cautious, selective buying by informed investors, not in a dramatic climax usually found at a market top.
— Stuart Evens