Novice Traders’ Notebook
Cardinal Reversal Patterns — At Tops
6. The Broadening Top
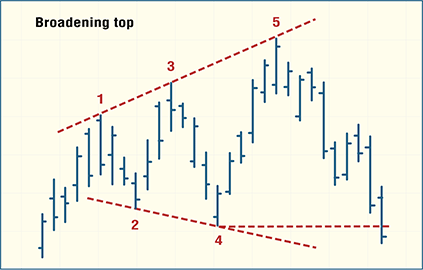
The Broadening top is a relatively rare formation that looks like an inverted triangle. Instead of increasingly narrowing fluctuations in prices, the broadening formation is formed by price swings that are increasingly widening. The most common of these patterns, shown below, consists of three successively higher peaks and another line connecting the two lows combine to give the price formation its distinctive pattern.
An additional difference between this formation and the triangle is the change in volume. Whereas volume contracts with the triangle, indicating investor indecision, volume in the broadening top usually expands right along with prices, indicating a volatile emotional market. The combination of wide price swings and increasing volume implies a frenzied market that’s out of control, symptoms of market tops rather than bottoms. As a result, these patterns are rarely found at market bottoms.

THE BROADENING TOP. The Broadening top usually consists of three ascending peaks and two descending troughs. The completion of the formation and signaling of the top occur when the price violates the second of these two troughs.
The signal that the market has topped occurs when prices fall below the lower low. Prices may again test the third peak but usually don’t exceed that level. In addition, in some cases, the third peak might not actually exceed the second peak before prices drop and fall below the second low, providing an early indication that the market is topping. The broadening top is considered complete once this violation of the second low is made.