Novice Traders’ Notebook
Charts
3. Candlestick Charting
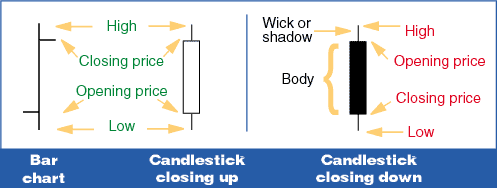
A charting method originally from Japan in which the high and low are plotted as a single line and are referred to as shadows. The price range between the open and the close is plotted as a narrow rectangle and is referred to as the body. If the close is above the open, the body is white. If the close is below the open, the body is black.

RELATED READING
Nison, Steve [1991]. Japanese Candlestick Charting Techniques, New
York Institute of Finance/Simon & Schuster.
Yamanaka, Sharon [2002]. “When Candlesticks Cast Long Shadows,” Technical
Analysis of STOCKS & COMMODITIES, Volume 20: June.
_____ [2002]. “The Engulfing Pattern,” Technical Analysis
of STOCKS & COMMODITIES, Volume 20: January.