Novice Traders’ Notebook
Charts
1. Reading Charts
What are the three most important things to look for in a chart?
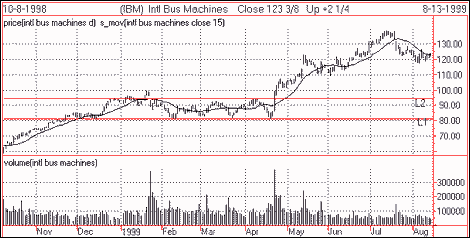
Charts indicate different things about general market conditions or specific securities. In the graph below, the three most striking things are:
- Price movement
- Support and resistance levels
- Volume
These provide significant factors a trader needs to know in his/her day-to-day operations.

Price movement can be determined by analyzing the moving average, which reveals major and minor trends by smoothing out fluctuations. From October 1998 to early January 1999, the moving average (based on a 15-day value) exhibits an upward slope. It then starts to flatten out, indicating the upward trend has diminished. The flattening of the moving average means the stock is going through a trading range, which may continue for extended periods. During this time, the price of the stock will fluctuate between the support and resistance lines, marked L1 and L2, respectively.
The stock has been in a trading range between January and April 1999. The end of the range is signaled by a breakout in price, which goes through the support or resistance levels and moving average line. In this particular case, in late April 1999, the price breaks out above the resistance level and moving average. This move is accompanied by an upsurge in volume. Generally, such a condition shows the beginning of a powerful rally.
As you can see, moving averages, support and resistance levels and volume can provide clues to many factors that help the trader in making buy/sell decisions. Understanding the relationship between these three indicators and price movement will provide a good starting point for conducting further analysis.