Novice Traders’ Notebook
Cardinal Reversal Patterns — At Bottoms
7. The Complex Bottom
The complex bottom is a broad group of relatively irregular price patterns that don’t really fit in any other category and are mirror images of the complex top patterns. When these patterns occur after a market downtrend and precede an uptrend, they are referred to as complex bottoms.

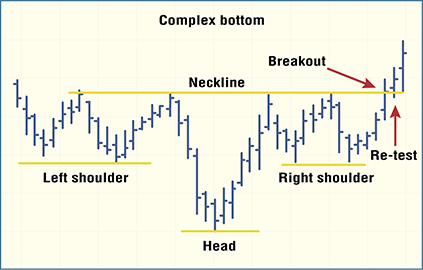
COMPLEX BOTTOM. A complex head-and-shoulders bottom formation is one of the patterns belonging to this relatively rare group. It is the most common and symmetrical pattern of the group, with the multiple-shoulder variety illustrated here. Once prices break the neckline to the upside, the pattern is considered complete. Prices may retest the neckline, but usually find support at the neckline.
As a whole, the group occurs less frequently than some of the more common patterns, but within the group, the complex head-and-shoulders bottom is the most common. It is also the most symmetrical of the group. This pattern consists of multiple heads and/or multiple shoulders and is just as, if not more, reliable than the standard variety of head and shoulders.
The complex head and multiple shoulders bottom occurs more frequently than the multiple-head variety, and they usually have the same number of shoulders per side. The figure shows a complex head-and-shoulders bottom with one head and two shoulders on each side. The shoulders usually form at about the same level, and the neckline is relatively horizontal. However, this describes the typical pattern, and exceptions do occur. The shoulders might form at slightly different levels, or the neckline might slope from one side to the other. In any case, the pattern is completed when prices break out above the neckline and start a new uptrend. On occasion, prices will retest the neckline but find support and continue to rally. The pattern is said to have failed if the price breaks back below the neckline. Like the complex top, the complex bottom has no consistently repeated volume pattern of significant predictive use.
— Stuart Evens