Novice Traders’ Notebook
Charts
2. Daily And Weekly Charts
When is the best time to look at weekly charts or daily charts?
The time frame that you use to study charts depends on your trading horizon. If you are a short-term trader who looks at end-of-day charts and have a trading horizon of no longer than one year, you should be using daily charts for trading. If your trading period is longer than one year, you are better off using weekly charts, which help study the market from a longer-range perspective.

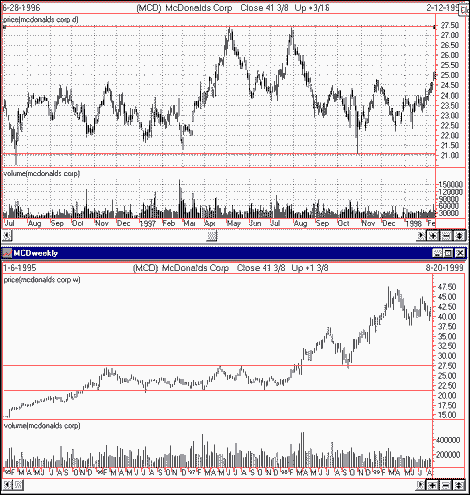
However, it is always best to use more than one time frame for analyzing charts. If you use daily charts for trading it would be helpful to also look at weekly charts, which help identify support and resistance levels and the direction of the major trend.
Judging from the weekly chart of McDonalds, between 1996 and 1997 the stock was in a trading range. Notice the support and resistance lines at 21–1/16 and 27–7/16, respectively. From the daily chart you can see that during 1997 you could have taken advantage of these support and resistance levels in your short-term trading. The daily chart is a magnification of the weekly chart.
The same concept can be applied to any time frame. For example, if you are a daytrader who studies intraday charts, look at daily charts to identify the major direction of the trend and support and resistance levels.