Novice Traders’ Notebook
Other Reversal Patterns
2. Diamond Formation
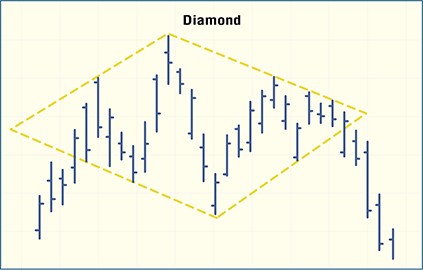
The diamond formation reversal pattern is found relatively infrequently. When it does form, however, it usually does so at market tops rather than at bottoms. This is consistent with its appearance, which suggests a confused, active market found at a top more often than at a bottom. As the figure shows, the diamond starts off as a broadening formation and then consolidates, usually forming a symmetrical triangle. The combination of price patterns first broadening and then consolidating gives the geometry for which the diamond is named. This shape becomes more apparent when trendlines, like those shown, are drawn connecting successive peaks and valleys. The shape has also been described as a complex head and shoulders with an odd center movement.

DIAMOND FORMATIONS. This reversal pattern, which is found relatively infrequently, usually shows up at market tops rather than market bottoms. This is consistent with its appearance which suggests a confused, active market found at a top more often than at a bottom.
Volume activity can help distinguish a diamond from an ordinary head-and-shoulders formation. The tendency might be to see a formation and interpret it as a diamond, when in reality it is only a head-and-shoulders pattern. This bias toward the diamond might be because an upsloping neckline would allow an earlier entry of the position and therefore more potential profit. A genuine diamond pattern is signified by a decrease in volume during the second half of the price pattern.
This volume pattern is similar to the one found in a standalone symmetrical triangle. When a diamond forms at a top, the following downmove is usually significant. A minimum expectation of the move can be estimated by measuring the distance in points at the widest part of the diamond. Prices usually move from the breakout price to a low, giving a net change at least equal to this measurement, typically further.