Novice Traders’ Notebook
Cardinal Reversal Patterns — At Tops
2. The Head-and-Shoulders Top
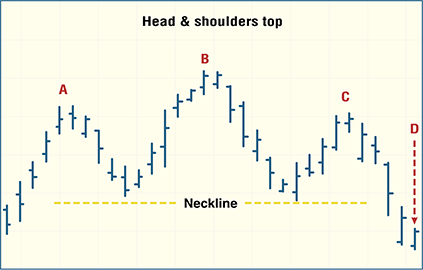
One classic chart pattern, the head and shoulders top, is thusly named because of its similarity to the outline of an individual. This reversal formation is a critical form to look out for because it denotes the very clear failure of the market to continue in an uptrend. Every technician learns to watch for this pattern.
The development of the head and shoulders formation begins with the formation of the left shoulder (A). This in itself is innocuous, because the left shoulder is simply a price consolidation in an uptrend. However, the activity during the development of the left shoulder begins with increased volume; in retrospect, this may possibly be peak volume, because the market reaches a new high in the uptrend only to stall and consolidate, completing the form of the shoulder. At that point, the fundamentals driving the trend are generally supportive.

When the market pauses, volume recedes, indicating a dearth of supply and therefore warranting a positive reaction from the traders. The uptrend then continues, reacting to timely positive news, and advances to a new high with expanding volume and forming the head (B).
But often, volume levels do not surpass the level observed during the formation of the left shoulder. Soon thereafter, the uptrend stalls as traders opt to move to the sidelines. The price activity levels off, again with the volume receding. For the time being, the trend appears to be intact and simply undergoing a normal correction in an upward trend. The correction may retrace to the level of support established during the formation of the left shoulder. At this point, buyers should reemerge and reestablish the uptrend. During this phase, the uptrend may make it back to the highs seen during the formation of the right shoulder (C). An absence of volume will be noticeable here, indicating that demand is not of high quality.
As the right shoulder is being traced on the charts, the technician can draw a trendline, referred to in this situation as the neckline, identifying crucial support along the support levels of the left and right shoulders. This trendline will often be parallel to a line drawn along the peaks of the left and right shoulders. However, the key negative indication is the low volume during the development of the right shoulder. This lack of volume indicates that the smart money was selling into the exuberant rallies, giving up their positions to the latecomers. The sell signal and confirmation of the trend reversal is a penetration of the neckline, accompanied with expanding volume. The price break is the beginning of a bear market. Many times, the market will retrace, retesting the break of the neckline. The inability of the market to return above the neckline of the head and shoulders top brings about another wave of selling.