Novice Traders’ Notebook
Indicators
6. Moving Average Convergence/Divergence
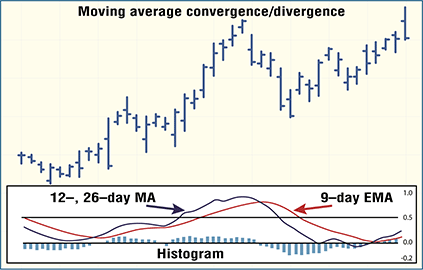
A trend-following indicator devised by Gerald Appel in the 1970s, the moving average convergence/divergence (MACD) identifies crossovers, finds overbought/oversold conditions, and tracks divergences. Simply, the MACD is the crossing of two exponentially smoothed moving averages that are plotted above and below a zero line. The crossover, movement through the zero line, and divergences generate buy and sell signals.

According to Steve Achelis, the MACD is most often calculated by subtracting a 26-day moving average of a tradable’s price from a 12-day moving average of its price, resulting in an indicator that oscillates above and below zero. Then the nine-day exponential moving average of the MACD line is plotted.
According to John J. Murphy, the MACD histogram is a variation, plotting the difference between the signal and MACD lines. The changes in the spread between the two lines can be spotted quicker, leading to earlier trading signals.
— EMS Flynn
SUGGESTED READING
Achelis, Steven B. [2000]. Technical Analysis From A To Z, McGraw-Hill.
Appel, Gerald [1985]. The Moving Average Convergence-Divergence Trading Method, Advanced Version, Scientific Investment Systems.
Colby, R.W., and T.A. Meyers [1988]. The Encyclopedia Of Technical Market Indicators, Dow Jones-Irwin.
Gopalakrishnan, Jayanthi [1999]. “Trading The MACD,” Technical Analysis of STOCKS & COMMODITIES, Volume 17: October.
Hartle, Thom [1991]. “Moving Average Convergence/Divergence (MACD),” Technical Analysis of STOCKS & COMMODITIES, Volume 9: March.
Murphy, John J. [1999]. Technical Analysis Of The Financial Markets, New York Institute of Finance.
Wu, Amy [2001]. “A Taste Of The Big MAC/D,” Technical Analysis of STOCKS & COMMODITIES, Volume 19: December.
— Amy Wu