Novice Traders’ Notebook
Indicators
5. Momentum
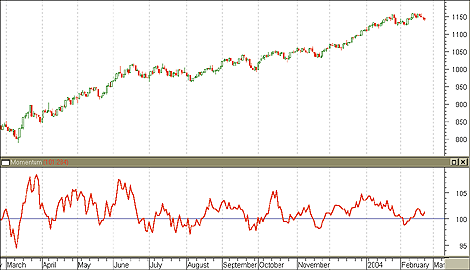
The momentum indicator was first presented in J. Welles Wilder’s New Concepts In Trading Systems and has since become a popular technical tool. Price momentum is defined as the measure of velocity of price change or market speed. The difference method for calculating a momentum indicator is the following: have n be the time period (usually 14 days), then subtract the close n periods ago from the present close period. If both of these closing values are identical, then the difference is zero. If the present close is smaller than the previous close, the momentum will be negative. Likewise, if the present close is greater than the previous close, the momentum will be positive. This indicator is an oscillator because the values are determined by their place above, below, or on the zero line. Above the zero line, go long; below the zero line, go short.

MOMENTUM. Here’s an example of the momentum indicator.
The momentum indicator is similar to the price rate of change indicator. However, the momentum indicator measures rate of change as a ratio as opposed to a percentage.
There are essentially two ways to utilize the momentum indicator:
- Trend-following oscillator
As a trend-following oscillator, the momentum indicator is similar to the moving average convergence/divergence (MACD). When the indicator shows bottoms, that’s a buy signal; when the indicator rises, that’s a sell signal. If the momentum indicator reaches extremes, this should be taken as a continuation of trend. As a caveat, wait for aftertrade prices to confirm the signal of the indicator. - Leading indicator
Using the momentum indicator as a leading indicator means that you assume market tops are characterized by rapidly increasing prices and rapidly decreasing prices. During these peaks and bottoms, the momentum indicator will diverge drastically.
COMBINING MOMENTUM WITH THE RSI
Using the relative strength index (RSI) in conjunction with the momentum indicator can hedge risks of the RSI being incorrect. Agreement between the 14-day RSI and the 14-day momentum can create a solid strategy for entering and exiting the market. This combination requires mutual agreement to enter the market; it only requires one signal to leave the market. Stuart Evens outlines this method as follows:
- Long: RSI rises above 50 but stays below 70, and momentum rises above zero
- Close long: RSI falls below 50, or RSI rises above 70, or momentum drops below zero
- Short: RSI falls below 50 but stays above 30, and momentum falls below zero
- Close short: RSI rises above 50, or RSI falls to 30 or less, or momentum rises above zero.
— Amy Wu