Novice Traders’ Notebook
Other Reversal Patterns
4. One-day Reversals
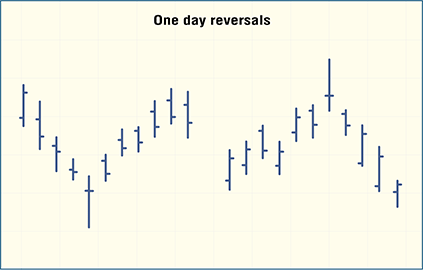
One-day reversals occur when a tradable instrument in a trend sustains a sharp price spike and then reverses, ending in a marked rise or drop. This formation, which is considered to be a potential key reversal day, can be seen either at a top or a bottom. According to Thomas Bulkowski, many one-day reversals represent “nothing more than temporary pauses in the existing trend after which the trend resumes its course.”
The one-day reversal occurs at the end of the trend. This pattern can also be seen in a one-week reversal.

A. One-day reversal tops
One-day reversal tops can be identified by a single-day spike, with prices falling and closing near a low. Look for a rising trend to identify a one-day reversal top.
B. One-day reversal bottoms
One-day reversal bottoms can be identified by a single-day spike, with prices rising and closing near a high. Look for a declining trend to identify a one-day reversal bottom.
— EMS Flynn