Novice Traders’ Notebook
Cardinal Reversal Patterns — At Bottoms
5. The Ascending Triangle Bottom
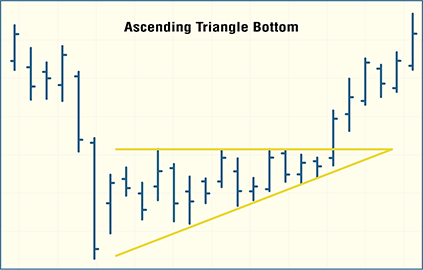
In the ascending triangle bottom, the ascending triangle usually acts as a continuation pattern in an uptrend, but sometimes can be found at the bottom of a downtrend, signaling a reversal. The ascending triangle, one of two right-angle triangle patterns, has a flat upper trendline while the lower trendline slopes up. This is indicative of more aggressive buying than selling as the lows get progressively higher, while the highs make it to about the same level each time before breaking out to the upside.

THE ASCENDING TRIANGLE BOTTOM. The triangle bottom is signaled by an ascending triangle in which a flat upper trendline and ascending lower trendline meet and compel prices within the two lines.
The completion of the formation occurs when prices break through the upper flat trendline, usually close to the apex of the triangle. This signals bullish conditions. Similar to other patterns, in this case, prices could retrace to the horizontal trendline before resuming their upward path but not reenter the triangle. Unlike symmetrical triangles, which are neutral in predicting breakout direction, ascending triangles usually break out to the upside. This is also true when preceded by an uptrend. Therefore, ascending triangles act as a continuation pattern, rather than a bottom.
Typically, volume will contract during the formation of an ascending triangle bottom and then increase during the breakout above the flat trendline. This corresponds to the number of shares for sale diminishing at the upper trendline price, as buyers bid the stock up and try to catch the breakout.