For those traders who want a clear and brief explanation of various concepts often touched on in technical analysis and trading, we offer Traders' Notes.
INTERMARKET ANALYSIS
Intermarket analysis, one of the pillars of technical analysis, is the comparison of the price action of one market to another. This comparison can be as simple as placing two different charts side by side. The most widely endorsed use of intermarket analysis hails from the Dow theory, whereby the movement of the Dow Jones Industrial Average (DJIA) is compared with the Dow Jones Transportation Average (DJTA). The theory holds that if both averages are trending higher, the investor should conclude that the underlying fundamentals driving the stock market are sound and that the trend of the market is up. When one of the averages begins to diverge -- for example, one average trends to higher highs, while the other average fails to make a higher high -- a warning is signaled (Figure 1) but not necessarily a reversal, as the markets may get in gear at a later point. The key is that intermarket analysis can aid the investor in determining the trend of the market as well as alert the investor to a potential trend reversal.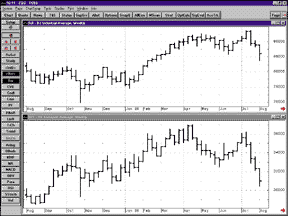
Intermarket analysis has many uses. An important intermarket relationship for stock investors and traders to monitor is the one between interest rates and the stock market. As a general guideline, a rising rate environment is negative for stocks; likewise, falling rates are bullish for stocks.FIGURE 1: DJIA VS. DJTA. During July 1998, the DJIA moved to a new high, while the DJTA failed to confirm. This divergence forewarned of the downtrend.
A quick look at Figure 2 shows that our proxy for interest rates is the Treasury bond futures market. As T-bond prices move inversely to yield, an uptrend in T-bond prices indicates a falling interest rate. Note that the T-bond market has been in an uptrend for more than a year (falling rates), and the stock market has followed suit. T-bonds peaked in October 1998 and have since moved sideways, while the stock market has continued to rise. At this point, we can conclude that a stable interest rate environment is still supportive of the stock market.
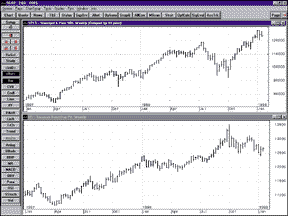
Another example of intermarket analysis can be seen in how the commodity market compares with the interest rate market. The guideline here is that falling commodity prices imply low inflation pressures and therefore are supportive of T-bond prices (Figure 3). On the other hand, if commodity prices are rising, then bond investors become concerned about inflation reducing the spending power of T-bonds, and consequently, T-bond prices tend to fall.FIGURE 2: S&P 500 VS. T-BOND FUTURES. The T-bond market has been in an uptrend for more than a year (falling rates), and the stock market has followed the same trend.
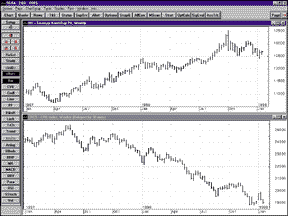
Another feature of intermarket analysis is deciding which group of stocks to trade or invest in. Figure 4 compares NASDAQ to the Standard & Poor's 500. You can see that during December 1998, the S&P 500 consolidated, tracing out a slight downward pattern, while NASDAQ continued to make higher highs and higher lows. This example of superior relative strength indicated that between the two, the better place to invest was in NASDAQ stocks.FIGURE 3: T-BONDS VS. CRB. Falling commodity prices are a sign of low inflationary pressure and can lead to a bond market rally.
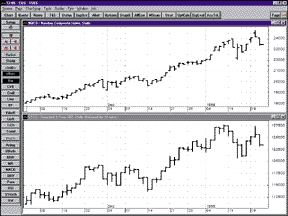
Figure 5 is an example of group analysis. Here, looking at how various sectors are performing relative to each other is an additional tool available to the investor. The two indices are the Morgan Stanley Cyclical Index and the S&P 500 Retail Index.FIGURE 4: NASDAQ COMPOSITE VS. S&P 500. During December 1998, the S&P 500 consolidated, tracing out a slight downward pattern while NASDAQ continued to make higher highs and higher lows. The superior relative strength was a good sign for NASDAQ.
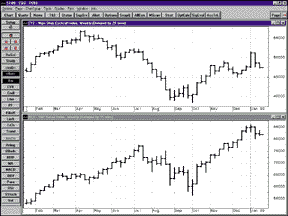
The two weekly charts tell an interesting story. The cyclical index peaked in July 1998 and has not made a new high in 1999, while the retail index has. This indicates that the stocks in the retail index are the better opportunity compared with the stocks that make up the cyclical index.FIGURE 5: MORGAN STANLEY CYCLICAL INDEX VS. S&P 500 RETAIL INDEX. The stocks in the retail index were a better opportunity compared with the stocks that make up the cyclical index.
Another comparison is the gold/silver stock index (XAU) compared with the price of gold (Figure 6). Note how the gold market, after a rally in the fourth quarter, traded with a series of lower highs and lows, and the XAU has followed the same course. The gold market and the XAU continue to confirm the relative weakness of this stock group compared with the stock market.
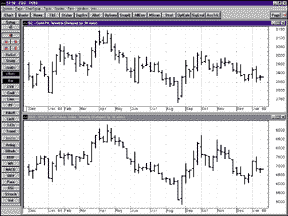
Many market analysts have written about intermarket analysis; two of the best-known are Martin Pring and John Murphy, with the latter covering the topic with his popular Intermarket Technical Analysis. As they note, intermarket analysis is a powerful technique for traders and investors. The relationships described here are not static. Therefore, developing a working knowledge based on a historical review of these relationships is time well-spent.FIGURE 6: XAU VS. GOLD FUTURES. After a rally in the fourth quarter, the gold market traded with a series of lower highs and lows. The XAU followed the same course. The gold market and the XAU continued to confirm the relative weakness of this stock group compared with the stock market.
FURTHER READING
Forest, Richard [1992].
"Intermarket Analysis And The Deutschemark," Technical Analysis
of STOCKS & COMMODITIES,
Volume 10: February.
Hartle, Thom [1991].
"John J. Murphy, Intermarket Analyst," interview, Technical Analysis
of STOCKS & COMMODITIES,
Volume 9: June.
Murphy, John J. [1991].
Intermarket Technical Analysis: Trading Strategies For The Global
Stock, Bond, Commodity, And Currency Markets, John Wiley & Sons.
_____ [1992]. "The Link Between Bonds And Commodities," Technical Analysis of STOCKS & COMMODITIES, Volume 10: May.
_____ [1992]. "The CRB Index/Bond Ratio," Technical Analysis of STOCKS & COMMODITIES, Volume 10: July.
_____ [1992]. "Interest Rates And The US Dollar," Technical Analysis of STOCKS & COMMODITIES, Volume 10: October.
Pring, Martin J. [1992].
The All-Season Investor, John Wiley & Sons.
Originally published in the March 1999 issue of Technical Analysis of STOCKS & COMMODITIES magazine. All rights reserved. © Copyright 1999, Technical Analysis,Inc.