BASIC TECHNIQUES
High Volatility And
Market Turns
by William Brower, CTA
Does an increase in volatility indicate a market top? This historical look offers some insights.
Back in 1994, it was exciting for traders watching the Standard & Poor's 500 index to get a true range day of four full points or better. These days, that small a daily range is rare; instead, we are becoming accustomed to true range days that are 10 and 15 full points. Is today's volatility unusually high by historical standards? And more important, can high volatility be used to predict major market turns? I wanted to look at data going back to the crash of 1929. I chose the Dow Jones Industrial Average (DJIA), as imperfect as it is, as my market proxy. The problem with the DJIA is that its components have changed so radically since then that it doesn't really represent the industrial sector anymore.
In addition, the DJIA may be a poor proxy for the broad market today, because momentum and index-driven funds trade DJIA stocks. Further, the large-capitalization stocks may be more volatile than the rest of the market. In fact, the DJIA can move in directions different from the broad market as measured by indices such as the NASDAQ or the Russell 2000.
However, the capitalization of the DJIA is a substantial portion of the overall market. That, coupled with the longevity of the DJIA history, makes it one of the few indices we can use to perform long-term analysis.
HISTORY
I wrote a program for TradeStation (see sidebar, "Volatility%") to analyze the true range of the DJIA. I wanted to know how common 3% true range days (TRD) were. A 3% TRD is defined as a day where the true range divided by the price is greater than or equal to 3%. This kind of volatility would get most S&P 500 day traders excited. With the DJIA standing at 7887, a 3% TRD would require a move of 236 points or more. The comparable intraday S&P 500 activity would be in excess of 27 full points. Even the recent extreme moves of the S&P 500 and DJIA have not reached these levels of volatility very often.
So how rare is a 3% TRD? From October 29, 1928, through July 13, 1997, they have occurred less than 7.2% of the time. Think of it. That isn't so rare! That implies that on average, we can expect a 3% true range day once every two and a half weeks or so.
However, we know from experience that we don't get one every other week. So what's the problem? Closer inspection reveals that they occur in bunches. The largest collections are related to the crashes of 1929 and 1987. Bear markets also account for a large percentage. A smaller portion occurs during bull markets, and most of those occur early on. What if we remove the 3% TRDs that are related to the two big crashes of 1929 and 1987 and the raging bear market that occurred as a result of the crash of 1929?
If we begin our dataset in July 1935, when the recovery from the bear market began, and eliminate October 1, 1987, through February 29, 1988, we get a different picture. We find that a 3% TRD occurs only 2.9% of the time, most of which is during bear markets. You can see how rare the 3% TRD really is during a bull market. In the last year, there have been only three days that qualify as 3% TRD. Those occurred on March 27, 1997, August 15, 1997, and September 2, 1997. All three occurred during minor corrections.
Since most 3% TRDs occur in groups, we can count them with an indicator and display the count as a percentage. One way is to see how often they occur in the previous NBars. In the Volatility% code for this indicator, we allow two inputs, the first of which is the volatility level (VolLevel) for which we want to search. It is expressed as a percentage of the price. We use a default value of 3%, meaning that any day where the true range is greater than or equal to 3% will be counted.

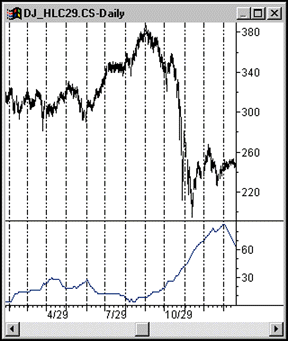
- FIGURE 1: DOW JONES INDUSTRIAL AVERAGE, 1929. The market crash of 1929 was accompanied by significant volatility readings for months prior to the crash. There were readings of 20% to 30% about six months before the crash. Then the readings declined and rose a bit just days before that period.
William Brower, CTA, is president of Inside Edge Systems and the publisher of TS Express journal. He trains TradeStation users, writes programs and tests systems. He can be reached at 203 454-2754 or via E-mail at 1000mileman@interramp.com.
Excerpted from an article originally published in the December 1997 issue of Technical Analysis of STOCKS & COMMODITIES magazine. All rights reserved.
© Copyright 1997, Technical Analysis, Inc.
Return to December Contents


