
Like the markets, technical analysis evolves. This article details the construction and use of bar-chart types beginning with a short review of older forms ? bar charts, candlesticks and Equivolume ? and a presentation of two new forms, flagbars and timebars.
The market is a profit-and-loss drama; rewards await for those who read it right, and penalties for those who read it wrong. Mastering various techniques is key, and the first step is to be familiar with charting forms -- learn what they do and use them to fit a need. Charts and their specific forms graphically represent the activity taking place in the markets. By studying chart patterns, investors and traders identify formations that can become the basis for their buy-and-sell systems.
In the real world, there is no ideal bar form. Different types of charting offer varying measures to understanding pattern formations. This article peruses the old, discusses the new and includes the following types:The old:
- Bar charts
- Candlesticks
- Equivolume chartsThe new:
- Flagbar charts
- Timebar chartsOHLC BAR CHARTS
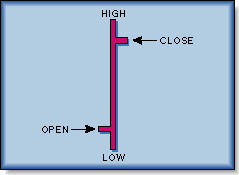
Bar charts (Figure 1) are the most common type of price charts used by traders and investors. A bar chart can represent any given period -- minutes, hours, days, weeks. In a daily bar chart, the vertical bar represents the day's price range -- the highest price to the lowest price. The open is the short horizontal dash that extends a few pixels to the left of the bar, while the close extends a few pixels out to the right.These open, high, low and close (OHLC) bars are good for studies of pattern profiles. Technical Analysis of Stock Trends by Robert D. Edwards and John Magee, an all-time classic on analysis of bar charts, discusses chart patterns: head-and-shoulders, flags and pennants, rounding tops and bottoms, cups and saucers, broadening formations, and so forth. Analysts believe that chart patterns graphically depict supply and demand forces that are realized on the exchange floor. Most people are first introduced to bar charts by reading the business section in newspapers and financial newsletters that display current activity using these bar charts.
CANDLESTICKS
Candlesticks is a Japanese charting system. Like bar charts, candlesticks require the same open, high, low, and close data for each period. Candlesticks emphasize the same period's open-close relationship (Figure 2), so the open is critical in the database.A candlestick contains a rectangular section, referred to as the real body, fixing the open and close for the period. Two thin lines, referred to as the shadows, mark the high and low, above and below the section. If the period closes higher than it opened, the real body is white; if it closes lower than it opened, the real body is black. In Beyond Candlesticks, candlestick specialist Steve Nison remarks that bar charts and candlesticks will show market trends, but candlesticks bring a new dimension -- intrinsic price changes -- into chart patterns.
Technicians expend a great deal of energy looking for reversal patterns. Candlesticks offer an advantage over OHLC bar charts because it may take weeks for OHLC bar charts to complete a reversal pattern. On the other hand, candlesticks form more timely patterns in that only one to three candlesticks may complete a single pattern, an advantage for day traders. The common base for candlesticks is three bars:
- Three parallel lines, suggesting a continuation of the market trend.
- Three unlike candles, with the center candle (usually a doji?) separated from its neighbors by gaps -- for example, a morning or evening star?, and an abandoned baby?.
- Three gaps that occur in a series between four like bodies, black or white. These gaps are common in exhaustion patterns that signal a reversal is near.
- Three mountains are large top formations similar to head-and-shoulder and triple tops.
- Three river patterns contain a center doji. The three-river evening star is bearish, while a morning star is bullish.

FIGURE 1: BAR CHARTS. Bar charts are the most common type of price charts used by traders and investors. A bar chart can represent any given period ? minutes, hours, days, weeks.
In real time, there is no ideal chart type, and no good or bad type to help you -- only charts with a higher or lower value filling a need.