INDICATORS
by Stephen J. Klinger, CMT
Here's a new twist on volume analysis, with a volume-based indicator for identifying meaningful trends.
Technicians recognize the importance of volume analysis and its application to price movement as requisite to any serious examination of stocks and market averages. While price is the most important dimension of market analysis, how prices move is a function of the intensity of volume that produced it. The true measure of durability behind price movement is most readily available through volume data. Since volume is a proxy for money flow, volume analysis can expose the internal dynamics -- the strengths and weaknesses -- of price action.
Frequently, volume divergences exist beneath the cover of price action and provide the only evidence of an impending reversal. Moreover, since volume is thought to precede price, its usefulness as a leading indicator of price strength or weakness can result in a more accurate assessment of price action. Finally, by converting volume statistics into an effective timing model, technicians would be better able to gauge the validity of a given price movement.USING VOLUME
For years, technicians have used volume as a confirming indicator of price movement. Rising volume is believed to accompany an uptrend, thus confirming the trend. Conversely, a price correction generally occurs on declining volume, often capitulating on an intense but short-lived liquidation. When volume deviates from the norm, price action should be called into question. Although volume is subject to distortions such as option expirations and program trading, its effectiveness as a barometer for stocks and market averages has been widely accepted by market analysts.While traditional approaches to volume analysis, approaches such as Joseph Granville's on-balance volume and, more recently, Marc Chaikin's Chaikin oscillator, do an excellent job of converting raw volume data into useful volume models, short-term tops and bottoms still go undetected. The Klinger volume oscillator (KVO) was created to provide traders with a volume indicator sensitive enough to consistently signal trading tops and bottoms by accurately reflecting the flow of money into and out of a security.
RATIONALE
Stocks and market averages advance and decline in patterns that deceive most investors. A stock can be under accumulation while closing down and in distribution while closing up. Although this occurs infrequently, it can be quite common in many of the price patterns that occur during a complete price cycle. Moreover, this may explain prices making higher highs and higher lows, yet closing down. Recognizing that this can occur makes its inclusion into volume analysis requisite to accurately assess price action. By redefining accumulation/distribution this way, the Klinger volume oscillator (KVO) represents a broad departure from traditional definitions of volume accumulation. The KVO is based on the following tenets:1 While a price range is a measure of movement, volume is the impetus behind the movement. Therefore, the sum of the daily high, low and close defines the trend. A stock is under accumulation when the sum is greater than the previous dayÕs total, and distribution occurs when the sum is less than the previous day's total. When equality occurs, the existing trend is maintained. To determine whether a stock is being accumulated or sold, the KVO utilizes trend data versus closing price data or the percentage relationship between the close and its midpoint.
2 Volume produces continuous intraday changes in price, reflecting buying and selling pressure. Where existing indicators focus on one side of the volume equation, the KVO quantifies the difference between the number of shares being accumulated and distributed each day in a security. This is referred to as the volume force. The KVO is based on the theory that the volume force is the true measure of volume fueling prices toward higher or lower levels and can therefore improve the reliability of buy and sell signals. Since price and volume normally rise and fall together, a vigorous and rising volume force should accompany an uptrend and contract in a downtrend, followed by a rising volume force, reflecting some accumulation before a trading bottom develops.
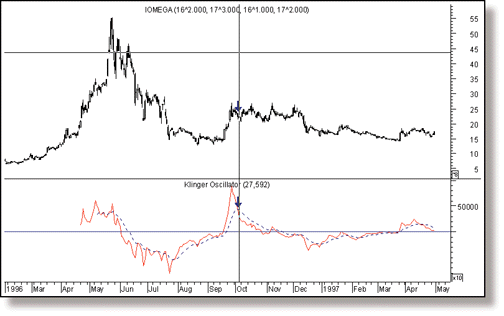
The most powerful use of the KVO comes when the indicator reaches an extreme reading either above or below the center line and reverses direction. This signals an exhaustion of the prevailing trend and warns of an impending reversal in price (Figure 1).
FIGURE 1: IOMEGA. Here, the KVO indicator reaches an extreme reading above the center line and reverses direction, which signals an exhaustion of the prevailing trend and warns of an impending price reversal.
Stephen J. Klinger has worked in the brokerage business as a financial consultant since 1985 and is currently with a full-service regional brokerage firm. Klinger is a Chartered Market Technician and a member of the Market Technicians Association.
