No financial topic has evoked more interest in recent years than predicting when the current bull market in stocks will end. On one side of the argument are the buy-and-hold adherents, whose methodology has scored remarkable success since the early 1980s. To them, a correction may be inevitable but immaterial, since the long-term trend is up. Those on the other side of the argument -- the market timers -- have attempted to call when the bull market high will occur, but have had little success to date. Market experts have attempted to call the top based on the price series alone, using such techniques as Elliott wave theory and chart formations, including the broadening top pattern. An influential group has relied on traditional market guidelines such as price/earnings ratios to point out that by these standards, the market is overvalued and due for a correction. And some Wall Street gurus have relied on proprietary economic analyses to call a top. Late in 1996, Federal Reserve Board chairman Alan Greenspan used the term bubble to characterize the current market.
IS THE END NIGH?
Why does a long-term investor care whether the bull market is coming to an end? Historically, stock market returns have outstripped inflation. The month-to-month and year-to-year fluctuations in price have not detracted from the long-term secular trend of the market. A glance at any stock market index, whether for 30 years, 50 years or 100 years, shows conclusively that the long-term trend is up. There are occasional pauses for consolidation in the trend, but inevitably, the market resumes its climb.
There are at least four reasons, however, why long-term investors should be concerned about the end of the current bull market. First, some investors will be changing their investment horizon as they approach retirement. A bull market top followed by a crash could deplete resources built up through years of disciplined investment.
Second, those investors who have recently entered the market may find that investments made at a top will not appreciate for a number of years. Those who made investments at the market top in early 1973 had to wait over seven years for the market to recover, for example. On an inflation-adjusted basis, such an investor had to wait even longer to get back to par.
Third, avoiding the volatility associated with a market correction or crash is in itself a significant investment objective, since volatility is equated with risk in such widely recognized measures of investment performance as the Sharpe ratio?.
Fourth and finally, a long-term market timing mechanism may offer the possibility of preserving capital near market highs as well as reinvesting at lower prices when the market resumes its climb.
WHAT WORKS
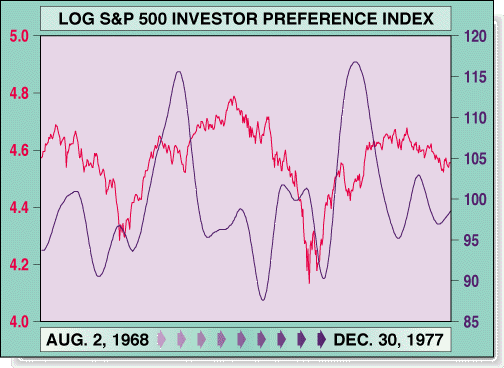
Last year, I noticed in What Works on Wall Street, the invaluable work by James O'Shaughnessy, that the relative performance of blue-chip stocks and growth stocks in one year was related to their performance in the succeeding year. My work in this area led to the development of a long-term market timing tool, the investor preference index (IPI).
The indicator is based on the difference in price action of two widely used stock market indices, the Standard & Poor's 500 and the New York Stock Exchange (NYSE) Composite Index. The S&P 500 is an index composed of 500 large-capitalization companies, with each company weighted by its market capitalization. More than 90% of its market capitalization is represented by companies listed on the NYSE. The NYSE is a market-capitalization weighted index of all common stocks listed on the exchange, currently more than 2,500.
The major difference between the S&P 500 and the NYSE is the mid-cap universe of approximately 2,000 listed stocks not in the S&P 500. As of year-end 1996, the total market capitalization of all NYSE stocks was about $6.75 trillion; the S&P 500, about $5.5 trillion. Thus, the 2,000-plus mid-cap NYSE stocks accounted for more than $1 trillion, or about 15% of the NYSE market capitalization.
While it is widely believed that bull markets end in a frenzy of buying of more speculative securities, the contrary is in fact true; the final stages of a bull market show a strong investor preference for blue-chip stocks. It is during the early stages of a bull market that mid-cap stocks are favored by investors. A possible explanation of this behavior is that investors, sensing that a top is imminent, perceive less downside risk in large-cap stocks.

FIGURE 1: NATURAL LOG S&P 500 WITH IPI OVERLAY. The first chart covers 1968 to 1977. The IPI fluctuates sharply in the early years of the study.
A question arises as to the robustness of any method developed with the benefit of hindsight, particularly one with as few market exits as IPI.