NEW TECHNIQUES
by Dennis Meyers, Ph.D.
Linear regression, a statistical technique that fits a straight line to data points, can also be a proxy for a market trend. Here's a trading system that uses the measured percentage change of the trend of the Treasury bond market.
The US Treasury bond futures contract is one of the most actively traded exchange contracts in the world. The US Treasury bond future is traded on the Chicago Board of Trade (CBT) and is used by major banks, institutions, and trading firms to trade, arbitrage and hedge their bond portfolios and associated derivative products. On the CBT, bond futures are traded from 7:20 am to 2 pm, and on the CBT Project A system, in the afternoons from 2:30 pm to 4:30 pm and in overnight session from 5:55 pm to 6:45 am. (The CBT recently discontinued the open outcry evening sessions in bond futures and replaced those sessions with the computerized Project A.) The trading volume in the US Treasury bond futures is big, and arbitrage keeps futures prices in line with the even larger over-the-counter Treasury bond market.
DATA DISCUSSION
The bond futures contract on the CBT trades in the quarterly cycles of March, June, September and December. The current active bond futures contract as of this writing is the US June 1998. The US June 1998 contract's last trading day will be on the seventh business day preceding the last business day of June 1998. The active trading contract will switch over to the US September 1998 contract on the first business day before June 1, 1998.
Each bond futures contract is worth the dollar value of the quoted price multiplied by $1,000. On February 6, 1998, the US June 1998 contract closed at 120-20/32, making the US June 1998 worth $120,625 (120.625 x $1,000). The bond future's smallest tick size is 1/32 of a point. Thus, a move of one tick is worth $31.25 per contract (0.03125 x 1000 = $31.25).
The US Treasury bond futures started trading in 1977, but for the purposes of this article we will limit our study to the price history from January 1, 1988, to today. In addition, we will only use the prices from the daytraded bond futures contract -- that is, the prices generated by open outcry on the CBT trading floor from 7:20 am CST to 2 pm CST. We will use a US Treasury bond futures continuous contract, since US Treasury bond futures contracts expire each quarter. A continuous contract is constructed by switching to the active contract on the rollover day and back-adjusting the difference in prices between the new contract and the old, thus creating a smooth continuous contract.

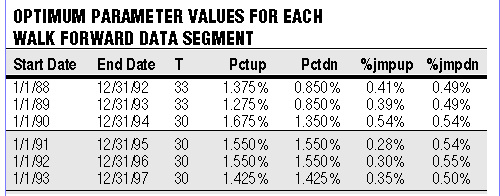
FIGURE 1: OPTIMUM PARAMETER VALUES. Here are the six-window data segments and their corresponding optimum parameter values. Most of the parameter values do not vary much from segment to segment, and therefore, it appears that five years is enough data to produce parameter values that are stable over the next out-of-sample year and that capture most of the price dynamics.
Dennis Meyers has a doctorate in applied mathematics in engineering. He is a member of the Chicago Board Options Exchange (CBOE), a private trader, and president of Meyers Analytics. His firm specializes in consulting for financial institutions and developing publicly available analytical software for traders. He can be reached 312 280-1687, via his Web site at https://www.MeyersAnalytics.com or via E-mail at meyersx@MeyersAnalytics.com.