NEW TECHNIQUES
by Mel Widner, Ph.D.
Support and resistance analysis is a proven method for selecting key price levels for trading decisions; traders usually perform the analysis by hand. The automatic charting method and new oscillators presented here are easy to implement and give a precise comparison of price to these important levels.
Sir Isaac Newton's first law of motion is one that is familiar to us all, stating that "Every body continues in its state of rest, or in uniform motion in a straight line, unless compelled to change that state by forces impressed upon it." It is relevant here, because the same can be said for price behavior. Like physical objects, prices have inertia and momentum. When at rest, prices often stay at rest, building congestion. When in motion, prices often stay in motion, along a trend. But like Newton's apple, price momentum changes when market forces are applied. The influencing event is sometimes known and sometimes not, but in any case cannot be hidden and can be seen in the price. Prices will often move in one direction for a period, only to stop and flatten or move in the other direction. This occurs because market forces have changed the momentum. The turning point has significance for future price behavior.
Consider an example. Suppose prices are moving higher, fed by steady cash flow and favorable expectations. Then, at some point, the advance begins to slow. Upward momentum is still dominant, but at that point it is diminishing and the rate of rise is decreasing, evidence of resistance. It is like throwing a ball into the air; the ball starts with initial momentum, then slows under the influence of gravity before eventually falling.
Prices behave in a similar manner. After opposing resistance forces are applied for a time, prices slow, finally stop, and reverse direction. The turning point is a resistance level and is the highest high price for that particular period. The converse is true for declining prices. A slowing decline results from support forces and a support level is established at the point where prices turn upward.
Simply, forces cause acceleration. Market forces do not directly produce momentum, but rather momentum changes. These momentum changes in turn are integrated or accumulated to establish momentum. The presence of market forces is evident when the slope of prices, or momentum, changes over time. The effect is most dramatic when forces also change, triggered by price moves or changes in expectations, and abrupt reversals occur. Examination of price histories can confirm the presence of these features.
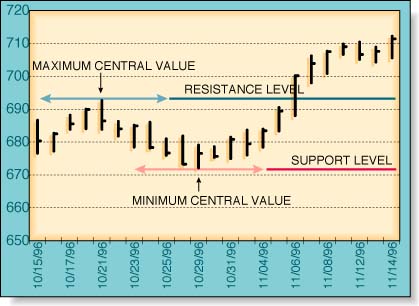
FIGURE 1: OEX CHART PATTERN. OEX chart pattern illustrating support and resistance levels is defined here using an isolated high and low method with a lookback period of N = nine bars.
Mel Widner holds a doctorate in engineering and is the developer of several new analytical methods, including projection bands, mobility oscillators, and rainbow charts. Comments are welcome at 703 791-5910 or E-mail at techstrategies@msn.com.