 |
|
or return to May Contents
AND ANOTHEREditor,
I liked very much the article by Robert Krausz in the February 1998 issue of STOCKS & COMMODITIES, "The new Gann swing chartist." This article belongs to the real world of trading, and without any doubt, his techniques work.
LAURENT PICHARD
Neuville du Poitou, France
via E-mail
NEW GANN SWING CHARTIST
Editor,
I picked up the February 1998 issue of STOCKS & COMMODITIES and I read, with great interest, "The new Gann swing chartist" by Robert Krausz. I have a number of questions about the rules and the examples.
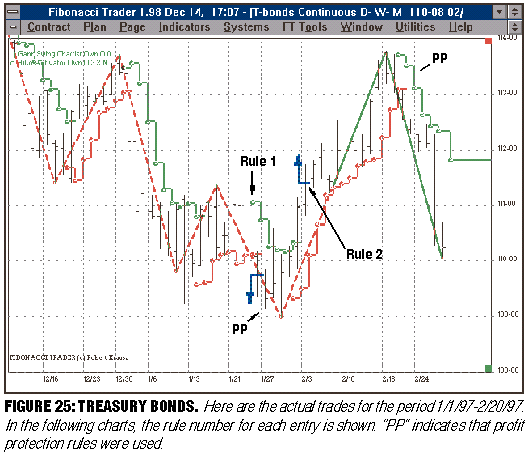
On page 56, Figure 25 shows a trade based on "Rule 1" being invoked on a downtrending movement. But how does one determine that the downturn started when it did? I would have thought it should start four days later. For example, look at the apex before the downturn (January 16). The next day does not have a lower low. On January 20 (Monday), there is a lower low than on the 17th (day 1), but January 22 saw a higher low. Thus, we are still in the uptrend at that point. January 23 and 24 have consecutive lower lows, so according to how I interpret it, January 22 ought to be considered the apex and not January 16, which was four trading days earlier.
If I were plotting this chart on a daily basis, then I could not have been certain about this downtrend until January 24 anyway; so how can the apex be on the 16th and not the 22nd?
The two other trend changes in the same chart I agree with; but how can anyone justify this one?
In addition, the Hi-Lo indicator is not fully explained; how it is formed is explained, but the function is not very well described.
Other than these points, it was an interesting article. Of course, until I am comfortable with the methodology, I cannot use it. Can anyone shed some light on these points for me?
MALCOLM SMITH
via E-mail
First off, I would recommend reviewing the rules and definitions so that you have a clear understanding of the basics. Then you will be comfortable with the methodology.
For example, you refer to a downturn, but that term is not used in the method's description. If you mean downtrend, a downtrend is defined in Figure 4, page 48 of the February 1998 issue: Trend changes from up to down. Prices must take out the nearest valley, and the trend was previously up.
During the period you are observing, only a downtrend was in force, as indicated by the dashed line. What did occur was an upswing and a downswing. An upswing occurs if the market makes two consecutive higher highs (as stated in Figure 1, page 48), and a downswing occurs if the market makes two consecutive lower lows (Figure 2, page 48).
Returning to your questions, beginning with January 10, the opening was higher than the previous day's high, and therefore, this day is counted as day 1 of a possible upswing. The next day is an inside day, and thus, the count begins again. January 14 is a higher high than January 13 and is a new day 1. January 15 is a second higher high and the market is in an upswing. January 16 is another higher high (and is the high for the upswing).
Jumping to January 22, the high is a second consecutive higher high, but not higher than January 16. On January 24, the low is the second consecutive lower low. A downswing is now established from the peak on January 16. The close is below the hi-lo activator and is therefore a sell signal. The hi-lo activator is explained on page 55: Add the last three period highs (or lows) and divide the sum by three, and in Figure 11, the hi-lo activator is plotted one period forward as a horizontal line.
I would suggest visiting the Fibonacci Trader Web site at https://www.fibonaccitrader.com/ and download the demo version of the Fibonacci Trader program. --Editor
(Reproduced from February 1998 "The New Gann Swing Chartist.")
RECOMMENDED READING
Editor,
Our investment club is very pleased with our subscriptions to your magazine. Although we have a great deal of knowledge on the fundamental analysis of stocks, we realize that we know nothing about the technical side of trading and investing in stocks. Bollinger bands and all the other technical tools are a mystery to us.
Could you recommend a few texts in the beginning-to-intermediate range on technical analysis, especially the ones that deal with the tools most written about in your magazine?
ANTHONY SANABRIA
via E-mail
See also the next letter.--Editor
NOVICE TRADER
Editor,
I am new to stock trading. Where can I learn the basics of trading stocks by using technical analysis?
ROBERT BARTLETT
via E-mail
Here is a list of classic reading material on technical analysis and the stock market:
Arms, Richard A. [1983]. Volume Cycles in the Stock Market, Dow Jones-Irwin.
Colby, R.W., and T.A. Meyers [1988]. The Encyclopedia of Technical Market Indicators, Dow Jones-Irwin.
Edwards, Robert D., and John Magee [1997]. Technical Analysis of Stock Trends, 7th ed., Amacom.
Fosback, Norman G. [1985]. Stock Market Logic, The Institute for Econometric Research.
Graham, Benjamin, and David Dodd (originally); Sidney Cottle et al. (5th ed.) [1988]. Graham & Dodd's Security Analysis, 5th Edition, McGraw-Hill.
Krausz, Robert [1997]. A W.D. Gann Treasure Discovered, Geometric Traders Institute, Inc.
Meyers, Thomas [1989]. The Technical Analysis Course, Probus Publishing.
Murphy, John J. [1991]. Intermarket Technical Analysis: Trading Strategies for the Global Stock, Bond, Commodity and Currency Markets, John Wiley & Sons.
_____ [1997]. The Visual Investor, John Wiley & Sons.
O'Neil, William J. [1988]. How to Make Money in Stocks, McGraw-Hill.
Pring, Martin J. [1985]. Technical Analysis Explained, McGraw-Hill.
____ [1992]. The All-Season Investor, John Wiley & Sons.
Rhea, Robert [1934]. The Story of the Averages, Rhea, Greiner & Co.
_____ [1962]. The Dow Theory, Rhea, Greiner & Co.
Sperandeo, Victor [1991]. Trader Vic: Methods of a Wall Street Master, John Wiley & Sons.
Wyckoff, Richard D. [1931]. The Richard D. Wyckoff Method of Trading and Investing in Stocks, Wyckoff Associates, Park Ridge, IL.
MORE INFORMATION FOR NOVICES
Editor,
I would like to learn more about technical analysis and trading. What Web sites and what books or other information (seminars, courses, etc.) can you recommend?
JOE P.
via E-mail
First, see my response to the previous question for suggested reading. Second, scan the advertisements in our magazine for technical analysis vendors with Web sites. Many of those Web sites in turn link with other Web sites related to technical analysis. Third, check the Trade News & Products and Books for Traders columns in our magazine, which present seminars, classes, conferences, product news, Web sites and books on trading. -- Editor
OEX
Editor,
What does OEX stand for?
THOMAS HARVEY
via E-mail
Actually, it's not an acronym; the letters don't really stand for anything. Here is an excerpt from an explanation I found at the Web site of the Chicago Board Options Exchange (CBOE) about the OEX:
What is OEX?
OEX is the symbol for options on the S&P 100 index. This is a capitalization-weighted index, covering a broad range of industries. Each index option contract represents 100 times the current value of the index. For example, when the index is 500, the dollar value of the index will equal $50,000.
Who created the S&P 100 (ticker symbol: OEX)?
The OEX was created by the Chicago Board Options Exchange and originally represented the top 100 stocks that traded on the CBOE in 1983. However, Standard & Poor's now manages the S&P 100 and is responsible for the addition and deletion of securities.
You can read the explanation in its entirety at https://www.cboe.com/index/oex/oexfaq.html#1. --Editor
STOCK SPLITS
Editor,
Where can I acquire a list of proposed stock splits? Some companies announce a stock as much as 60 to 45 days in advance. Can you tell me if such a list exists, and if so, where can I get it?
ELLEN SHINN
via E-mail
Perhaps someone reading this will have a suggestion. -- Editor
OPTIMIZATION OF TRADING SYSTEMS
Editor,
Jeffrey Owen Katz's July 1997 article ("Evaluating trading systems with statistics") seems to contain misconceptions concerning the statistical significance of trading systems.
First, the idea that a series of optimization tests can be evaluated by computing the probability of finding a statistic that's at least as good as that found in a sample of m tests is questionable both statistically and philosophically. The philosophic problem is more serious. Following this logic, if I got a good result from the first optimization test, then I should not perform any more tests, because that would only lead to less statistical significance. Hence, I would lessen the statistical significance of the first test. This suggests that I should never optimize. Katz properly points out that optimization can have only a beneficial effect if it is properly interpreted. Following Katz's logic, we should always optimize, and hence, the statistical significance of our test will always be reduced the more tests we perform.
But proper statistical analysis of optimization tests can be easily derived from Bayes's formula. What we should compute is the probability that the result (say, the average trade value) using the "best" parameter is from than some reference value. Frequently, the reference value is zero, so we compute the probability that the average trade using the "best" parameter differs from zero. Assume that before we optimize we have no idea which is the "best" parameter. Then the probability that the average trade using the "best" parameter is different from the reference value is simply: = Cum Prob (t value for best parameter test <> t value for ref. value)/Summation over all opt. tests i of (Cum Prob (t value for optimization test i) [that is, use a two-tailed test].
Finally, Katz misjudges the concept of interdependence of trades from a system. Katz refers to this as "serial correlation," although interdependence is a concept that is much broader than serial correlation. If your trading system contains interdependence that is statistically significant, this is an astonishingly great result! All you have to do once you get a trading result is take or reject the next trade, depending upon whether it's in the direction that your interdependence suggests. For example, if your system has "streaks" that are statistically significant, simply take all buy signals and reject all sell signals (except for exits) after the first buy signal and before the system gives you a sell signal. Once you alter that trading system to reflect the interdependence, the serial correlation will disappear. The standard nonparametric tests for the statistical significance of interdependence are repeated in Ralph Vince's The Mathematics of Money Management.
PAUL H. LASKY
via E-mail
Authors Jeffrey Owen Katz and Donna McCormick reply:
Is it true or misconceived that a series of optimization tests can be evaluated by computing the probability of finding a statistic as good as that found in a sample of m tests? Consider the following: Assessing statistical significance involves estimating the probability that an experimental result as good as the one you obtained could be due to chance alone. Suppose we have a set of optimization runs from which the best solution has been selected. We may then logically ask, What is the probability that a result as good as that achieved could have occurred by chance? This question calls on the standard measure of statistical significance mentioned earlier. In other words, we can ask, What is the probability of finding, by chance alone, at least one optimization as good as we did in a sample of m tests? But is this not precisely what you say is specious, statistically and philosophically? Is the standard notion of statistical significance fallacious?
Next, it is not true that I hold that additional optimization tests will only lead to less statistical significance. Even if we have a good result from the first optimization run, how do we know that we will not obtain a dramatically better result from the second, third or later run? We must carry out the experiment according to plan. It is true that you would lessen the statistical significance of the first test; that is, you will have shrinkage. But it is possible, even likely, that a later result will be sufficiently better than some earlier one even with shrinkage (that is, the reduction in significance due to multiple runs) factored in; a higher level of significance will be attained. You then draw the conclusion that one ought never to optimize, but in fact, we argue that one should always optimize. We have never stated or implied that one should always optimize; nor have we stated or implied one should never optimize. Sometimes optimization is appropriate, other times it is not. We only argue that if you do optimize, then you must take that fact into account; that is, you must discount your results, even if your optimizations are of an ad hoc, trial-and-error variety.
You suggest that the correct way to deal with optimization is using Bayes's rule. We have no argument with a Bayesian approach. (However, the formula you give appears incomplete.) A Bayesian formulation can provide a valid alternative if implemented correctly. However, a discussion of the differences between the Frequentist and Bayesian paradigms is beyond the scope of this reply.
Finally, on the subject of serial dependence and correlation: I believe you are saying our notion of serial correlation is incorrect, and that, in fact, all serial dependence will vanish once analyzed and incorporated into the system. First, the serial correlation or dependence will not disappear from the original system, and it is this system that we are actually studying and wish to infer something about. Of course, you can use your analysis of the base system to construct a new system, actually a metasystem, that takes into account any serial dependence. In such a case, the reader is correct in that the new metasystem will no longer evidence serial dependence and, to the extent that such serial dependence was present in the trades of the original system, will be more profitable than that system. But, I repeat, it is about the original system that we are trying to make inferences, not about some hypothetical system that we may later construct based on our analysis! If you are unhappy with our use of parametric correlation as a measure of serial dependence, there are other kinds of dependence than the kind that can be detected with parametric correlation. However, correlation is familiar, easily understood, and immediately useful if one is, indeed, going to design a metasystem. It is also more sensitive than any nonparametric statistic, assuming, of course, that any dependence takes the form of straightforward serial correlation.
Thanks to both S&C reader Paul Lasky and S&C Contributing Writers Jeffrey Owen Katz and Donna McCormick for their insightful comments. --Editor
NOVICE TRADERS' NOTEBOOK
Editor,
I have just ordered a trial subscription to your magazine. The Novice Traders' Notebook at your Web site is of special interest to me. If this feature is reflective of your subscription, I think I'll like it.
EDWARD KUPREL
Grosse Ile, MI, via E-mail
We try to include articles that suit a variety of readers' levels each month in the magazine, from our novice trader articles to more sophisticated techniques on building systems. We include charts, illustrations and spreadsheet code whenever possible to help demonstrate techniques. We hope you enjoy your subscription. -- Editor