CLASSIC TECHNIQUES
The Discrete Fourier Transform Illusion
by Dennis Meyers, Ph.D.
The Fourier transform is a mathematical technique for analyzing data to determine cyclical component. Take a close look.

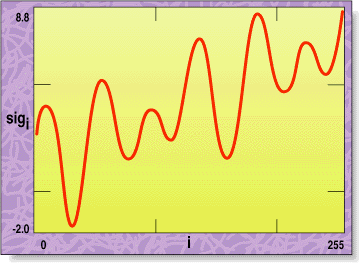
STOCKS & COMMODITIES is certainly no stranger to Fourier analysis. Back in 1983, S&C publisher Jack Hutson and Anthony Warren published a number of articles on using the Fourier transform and the fast Fourier transform (FFT) in analyzing stock prices. (For a primer on the FFT process, see the sidebar, "What is a fast Fourier transform?")FIGURE 1: CONSTRUCTED SIGNAL VS TIME (I).This is a signal with a constant value, a trend, and two oscillating frequency components.
Here, we will take a different approach and examine how the discrete Fourier transform (DFT) and its modern implementation, the fast Fourier transform (FFT), can be applied to the Standard & Poor's 500 daily index. I will demonstrate possible misuses of this sophisticated analysis this time, and next time, I will present a method to use this analytical process.
WHAT IS THE DFT?
The mathematical technique known as the DFT takes a discrete time series of n equally spaced samples and transforms or converts this time series through a mathematical operation into a set of n complex numbers, defined in what is referred to as the frequency domain. Why would we do that, you may ask? Well, we can do all kinds of useful analytical tricks in the frequency domain that are just too hard to do computationally with the original time series in the time domain.
Let's assume that the time series we are examining -- market data, say -- is made up of signals of various frequencies plus noise; in other words, short-term cycles on top of longer-term cycles plus day-to-day random movement. By applying the DFT to the time series data, we can convert the time series to the frequency domain and easily filter out the frequencies we have no interest in and minimize the noise in the data.
A simple example will show what I mean. Let us define the following signal:

for I = 0 to 255
Figure 1 graphs an example of this type of signal. This is a signal with a constant value, a trend, and two oscillating frequency components. Let's add some noise to the signal:

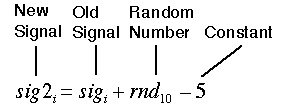
for each i, I = 0 to 255
where rnd-10 is a random number between zero and 10. The constant "5" is subtracted to adjust the random number range from +1 to +10, to -5 to +5. Figure 2 is a graph of the signal with the noise added. With the added noise, the signal has all but disappeared.