TRADING TECHNIQUES
The Channel Breakout System
by Mark Vakkur, M.D.
This is one of the simplest and oldest trading techniques, where trades are initiated based on price exceeding a given historical level. Here's how the channel breakout system works using the Value Line index, IBM, and the Fidelity Southeast Asia Fund.

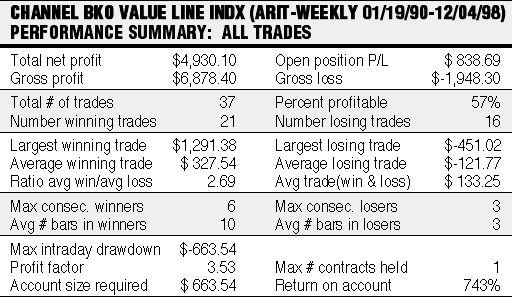
TO START WITHFIGURE 1: SUMMARY TABLE. Here's the performance of the channel breakout system for the Value Line Arithmetic Index, buying upon violation of a trailing three-week high and going flat upon violation of a trailing three-week low.
Most technical analysis systems can be divided into trend-following and oscillating. Some of the oldest and best systems, from point & figure charting to simple moving average systems, are nothing more than an objective attempt to identify and follow a trend until it changes. If the markets had no noise, there would be no need for technical analysis, no need to identify the most significant underlying market action.
Consider point & figure charting, which filters out all price movements below a certain threshold, such as a three-box reversal. The resulting xs and os reveal patterns that might otherwise escape the naked eye when viewing a standard bar chart and screen out others that might mislead you into a premature trade.
The breakout system is little different. Instead of requiring a certain price movement to define a change in trend, it requires a penetration of the lowest or highest price over a predefined lookback period. For example, with a six-week system, an uptrend is defined as intact until the lowest low over the prior six weeks is penetrated, and the resulting downtrend is assumed to be intact until the prior six-week high is exceeded. An infinite number of variations is possible, including using intraday versus closing price to define a penetration, using some sort of magnitude (for example, 1%) or time element (for example, three consecutive closes above a high) to define penetration more precisely.
The lookback window can also be varied for uptrends and downtrends. The system could be a stop-and-reverse system (always in the market, either short -- for downtrends -- or long -- for uptrends), long only, or some combination (for example, long under certain breakout conditions, short under independently defined breakdown conditions, and flat during neutral periods).