Subscribers can search for stocks based on technical indicators such as RSI, stochastics, and the directional moving index. Search parameters also include price and volume data, fundamental criteria, and moving averages. Users can select from a range of choices, or build their own queries to ferret out the type of stock they're interested in. Investors can locate moving average crossovers, spikes in volume, changes in momentum, or all of the above.
The price is $24.95 per month, plus exchange fees for real-time users. A two-week free trial is available.
BACKIQC Corporation
19433 E. Walnut Drive South
City of Industry, CA 91748
909 598-0388, fax 909 598-3266
info@iqc.com
https://www.icq.com/iqchart

Listen and learn from Al Frank, The Prudent Speculator; Michael Murphy, California Technology Stock Letter; John Murphy, formerly of CNBC, currently with MurphyMorris; Don Phillips, Morningstar; Norman Fosback, Mutual Funds Magazine; Bernie Schaeffer, Schaeffer's Investment Research; as well as dozens of other financial experts.
Browse and comparison-shop the financial exhibition hall, where you will find online investing exhibits from, among others, VectorVest, Data Broadcasting Corp., Zacks Investment Research, CBS MarketWatch, TheStreet.com, and many more. See first-hand the new financial products and services available for active traders, brokers, and investment managers. Share trading tips with like-minded attendees.
Call 800 970-4355 for free admission for two -- a $990 value. For exhibiting information, call 800 822-1134.
.
.
A two-day mini-course on options basics April 26-27 will cover concepts such as profit/loss diagrams, an introduction to volatility and delta, the use of options in hedging, and strategies for options trading. The fee is $500 per person.
@RISK runs Monte Carlo simulations with spreadsheet data, and Evolver uses genetic algorithms to arrive at spreadsheet solutions. The hybrid program can solve spreadsheet problems too complex for other programs to manage. It answers the questions "what if" and "what's best" at the same time.
The product will be attractive to Excel users who now take advantage of that program's Solver feature. RISKOptimizer provides the decision maker with information about the risk associated with his optimal solution. Priced from $695; upgrades from $495.
The program's goal is to help the trader control and alleviate the negative effects of trading stress, establish and maintain success expectations, and form and sustain an unshakable, positive attitude. The course is customized to incorporate each trader's personal goals, own words, and unique circumstances.
The program costs $175.99 and can be ordered over the Internet.

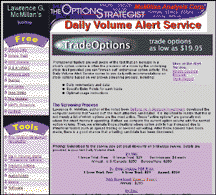
The new site provides an array of free tools and analysis. The free area of the site includes an options data page with implied and statistical volatilities for all underlying instruments on which options are listed -- stocks, futures and indices -- plus a snapshot of how the current figures compare with historical data of a similar nature. Stock option traders will also find the list of symbols by the underlying and the list of "wrap" symbols useful. There is a free page ("Option Talk"), where option traders can post questions to be answered by the company's president, Lawrence G. McMillan, author of Options As A Strategic Investment and McMillan On Options. Some simple option calculations are available for free as well.
On the main page, a free summary of McMillan Analysis' current market opinion can be found. The Website also offers a subscription service that identifies the underlying instruments with either the cheapest or the most expensive options on a daily basis. Finally, visitors can request free samples of The Option Strategist and a free trial to the daily publication Daily Volume Alerts.
The site offers a link to Real Audio daily market briefs that include close-of-day events. Market tips are also updated and offer practical recommendations for buying and selling. The site serves as a reference tool for traders of any level, beginning or experienced.

A new Website called the Internet Profit Guide from CTS Financial Publishing seeks to help educate investors in trading basics to help them control their financial risk before they get started. The site defines basic terms for beginning investors and outlines some of the technical analysis tools and indicators available for trading stocks, commodities and options that help improve returns on those investments.
The guide defines many technical terms used in trading and features an introduction to technical analysis. This site describes some of the most popular trend indicators and includes explanations about why prices move in certain directions and why certain patterns in the market can be predicted.
Sections specifically devoted to stock, commodity and options trading teach investors how to read and understand common tools to select and time investments. Current and historical statistics, it is emphasized, will help keep the online investor's impulsive actions in check, since no human broker is available to provide advice to online traders.
Some of the 14 topics covered in the guide include how to read stock and options charts; how to read futures and options charts and graphs; history; trading pitfalls; commodity and options profit calculators; and more.