TRADING TECHNIQUES
Moving Averages On Steroids
Buff Up Your Moving Averages
by Buff Dormeier
Want better results? Combine your moving averages with volume and see what happens.
Why should technicians only consider open/high/low/close numbers and time in forming price averages? The averages I use enhance performance by modifying the simple moving average with volume information. Volume represents the number of participants willing to wager at various points of price and time. My price averages measure the commitment expressed through a close, weighted by that day's volume compared to the total volume during the period of the average.

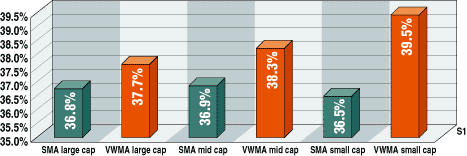
FIGURE 1: MORE PROFITABLE? In testing 60 securities over 2,000 days, volume-weighted averages performed better than simple moving averages in 60% of the cases. In 12% of the tests, there was no significant difference. Each column is the percent of profitable trades.
Weighting the price average gives greater emphasis to those days with greater
volume and less emphasis to those days with lighter volume. By enhancing
the performance of your moving averages with volume, you can increase responsiveness
and reliability.
TESTING
To illustrate how volume information improves performance, I tested and compared two trading systems. One system used a five- and 20-day simple (unweighted) moving average cross, while the other system used a five- and 20-day volume-weighted average cross.
The test took into account both long and short trades. A long position was taken when the short-term moving average (five days) crossed above the longer-term moving average (20 days). A short position was taken when the short-term moving average crossed under the longer-term moving average. Of the securities used in the test, 1,000 shares were purchased or sold short with each cross. Commissions were not included. The testing period used was September 25, 1991, to May 14, 1999, for a total of 2,000 trading days.
I selected securities from the small-cap (Standard & Poor's Small Cap Index), medium-cap (S&P 400 index), and large- cap (S&P 100 index) lists. Then I broke the groups down by their characteristic volume and volatility, forming 12 categories -- small-cap high volume, small-cap low volume, small-cap high volatility, small-cap low volatility, mid-cap high volume, mid-cap low volume, and so forth.
I tested five securities in each of the 12 groups, for a total of 60 securities (listed in sidebar "60 securities tested"). I used the five highest- and lowest-volume securities, as well as the five highest- and five lowest-beta (a measure of volatility) securities of each of the three capitalization groups, as identified by Bloomberg on June 30, 1999. Any securities that were duplicated (as high-volume and high-beta stocks were occasionally) were only used once. Securities that lacked sufficient history were removed.
Buff Dormeier is a technical analyst at T.P. Donovan Investments. He can be reached at bdormeier@tpdonovan.com.
Excerpted from an article originally published in the February 2001 issue of Technical Analysis of STOCKS & COMMODITIES magazine. All rights reserved. © Copyright 2001, Technical Analysis, Inc.
Return to February 2001 Contents