TRADING TECHNIQUES
How To Get Into The Trade
Double-Bottom Confirmation Strategy
by Arthur Hill
Here's a strategy using a tried-and-true pattern to achieve faster entry signals and improve the reward-to-risk ratio.
The double bottom that emerged in the Dow Jones Industrial Average (DJIA) and many other securities in October 1998 is a memorable formation, a powerful reversal. With the power behind it in mind, I developed an entry strategy based on the double bottom, or the second test of a key support level. I call it the double-bottom confirmation strategy.

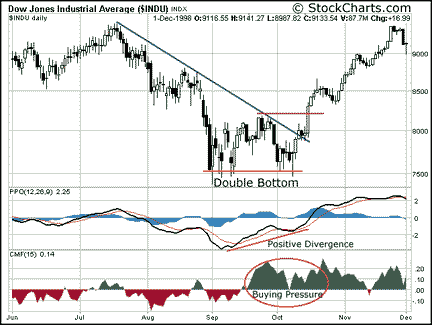
FIGURE 1: DOUBLE BOTTOM. In October 1998, the DJIA tested support from its September lows and began forming a double bottom. This reversal pattern was confirmed as bullish when the average exceeded its September reaction high. Prior to the breakout confirmation and 300-400 points lower, the percentage price oscillator (PPO) formed a positive divergence, Chaikin money flow was positive, and the average formed a short-term reversal.
DOUBLE BOTTOMS
Double bottoms are considered to be reversal patterns that form after a significant decline. They are marked by two roughly equal lows and confirmed when the peak between the two lows has been surpassed. The first low marks initial support with little clue that the downtrend may be near an end. The subsequent reaction rally's peak marks resistance, or the price at which overhead supply dominates. When the second low begins to form near the previous support level, it indicates that demand has begun to overpower supply. For the double bottom to be deemed complete, demand must be sufficient to propel prices off the second low and past the previous reaction high, thus conquering overhead supply. (See Figure 1.)
The double bottom can be one of the most reliable chart patterns, but waiting for traditional pattern confirmation can skew the reward-to-risk ratio. Traditional technical analysis tells us the double-bottom pattern is confirmed when the price surpasses the previous reaction high, well above the previous low. With a security well above key support, setting a stop-loss can be a precarious proposition. A stop-loss too close to the resistance breakout can result in a whipsaw, and one near double-bottom support can ruin the reward-to-risk ratio.
I needed a trading strategy to verify the robustness of double-bottom support levels and allow earlier entry. Such verification need not apply to textbook double bottoms only, but also to similar support tests that may offer buying opportunities. Even though such strategies can increase potential reward and reduce potential risk, they can also result in more whipsaws. To avoid whipsaws, I use indicators that avoid duplication and produce relatively few signals.
PICKING INDICATORS
It is important to select a set of indicators that complement each other. Multicolinearity, using indicators that are based on the same price variable and provide the same information, should be avoided. For example: rate of change (ROC) and relative strength index (RSI) are both based on closing prices and represent changes in price momentum. Using both would be redundant and may actually cause confusion if they do not confirm each other.
I chose the percentage price oscillator (PPO) to measure price momentum and Chaikin money flow to measure buying pressure. Both are calculated in a completely different manner and leave little chance for multicolinearity.
Arthur Hill is chief technical analyst for StockCharts.com. He writes a biweekly stockwatch column, a daily chart update on the markets, and contributes to the site's Education Center. In addition to being active in the markets, he is a full member of the Society of Technical Analysts (London). He can be reached via e-mail at arthurh@stockcharts.com or through www.stockcharts.com.
Excerpted from an article originally published in the February 2001 issue of Technical Analysis of STOCKS & COMMODITIES magazine. All rights reserved. © Copyright 2001, Technical Analysis, Inc.
Return to February 2001 Contents