Since the introduction of the spreadsheet, I've used its abilities in the continuing search for a profit-making trading system. In the process, I've developed several automated procedures, or macros. Some simply help by yielding additional ease in copying formulas or selecting graph ranges. Others are more extensive, such as subroutines awaiting inputs so that Fibonacci ratios and Elliott wave theories can provide price predictions.
I want to present two such macros, the continuous lead contract and the y-axis translator. (The latter macro is presented in a sidebar, "Input for y-axis translator,"page 28.) These macros were originally developed using Lotus Symphony. They have been converted and are presented here as Excel macros in Visual Basic.
The motivation for developing the continuous lead contract macro came from the time-consuming problems caused by expiring futures contracts. The difficulty is caused when the most actively traded contract - that is, the lead contract - expires, or rolls over to the next in line. Formulas requiring preceding data, such as moving averages or statistics, have to be handled carefully, because of discontinuous inputs when switching contracts - say, from the June Standard & Poor's 500 futures contract to the September.
Indicators for the new lead contract must be recomputed using data from the September contract, which makes it impossible to compare the indicators directly with the results from previous contracts. This is particularly true if their function involves an accumulation of values over time to arrive at significant support or resistance levels, or for divergence comparisons with price.
One of the best solutions to avoiding such problems was derived by CSI founder Robert Pelletier, and published in Commodities magazine (now Futures) in 1983. I tried to use Pelletier's method in the mid-1980s, but was discouraged by the large amount of resulting calculated data. Later on, I noticed lead contract rollover occurs over a short period of time for the S&P 500 futures (about 14-20 trading days). So I developed a simple procedure that provides a continuous lead contract (CLC), using prorated volume and open interest.
Because several indicators require volume and open interest as inputs, all of these components are prorated to provide a calculated set of values, but only over the short rollover period. Figure 1 shows S&P 500 CLC data ended with the expiration of the June 2001 contract. Figure 2 shows the S&P 500 cash data in the form of the Spy contract, which is 1/10 the value of the S&P 500 cash index. Note how well the three calculated rollover areas of the S&P 500 CLC chart agree with the values of the cash index.
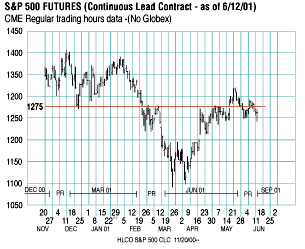
Figure 1: S&P 500 futures. Note the rollover periods in the continuous lead contract.
...Continued in the December 2001 issue of Technical Analysis of STOCKS & COMMODITIES
Excerpted from an article originally published in the December 2001 issue of Technical Analysis of STOCKS & COMMODITIES magazine. All rights reserved. © Copyright 2001, Technical Analysis, Inc.