FUTURESWEB.com
FUTURESWEB.COM: One-stop shop for basic futures information.
As stocks continue to frustrate traders and investors alike, more
than a few former stock jockeys have cast an eye toward the futures markets.
And with margin requirements for pattern day-traders - four or more daytrades
per account in five business days, if these trades are 6% or more of all
trades in the same period - increasing to $25,000, the futures market has
become increasingly attractive, almost by default.
But the futures market is quite different from the stock market in a number of crucial ways, in too many ways to list in a single article. Even some of the best texts introducing newcomers to the futures market, books like John Murphy's Technical Analysis Of The Futures Markets, Martin Pring's Introduction To Technical Analysis, and Jack Schwager's A Complete Guide To The Futures Markets, can be daunting, and often won't have some of the latest information on changes in the futures industry.
While these texts are excellent, if not essential, parts of any potential futures trader's continuing education, other resources such as certain websites can provide information that, while not as deep in some respects, has the advantage of being both topical and broad. Their breadth is largely due to their ability to hyperlink directly to the websites of exchanges such as the Chicago Board of Trade, the Chicago Mercantile Exchange, and many others.
Launched in 1998 by Jeff Pearl, Futuresweb.com is fast becoming one of those websites. Pearl felt that there was not enough "well-organized information" for people interested in getting into futures trading and, having been a broker for more than 10 years (while trading his own account and designing trading systems), he thought he could at least improve the climate for fledgling futures traders by building a better futures website.
"Futuresweb provides organization," he says. "If you need quotes, charts, news, research, broker ratings, or are simply looking for a website that is involved with the futures industry, then this is the easiest place to go and find it."
Futuresweb has all of the basics you'd want or need in a futures website: 30-minute delayed quotes on futures; options on futures; and quick charts scalable from intraday to weekly data (featuring the usual suspects as far as technical indicators are concerned: volume price oscillator, commodity channel index [CCI], stochastics). Data for the full range of futures contracts is included - from indices and interest rates to grains and livestock - making Futuresweb a one-stop shop for basic futures information. Market news is currently provided by Grants Pass Futures and Options and consists of capsule notes on specific tradable groups (currencies, energies, metals, and so forth), with options to subscribe for more news and settlement prices by way of e-mail. Additional news content is provided by Dailyfutures.com, a free commodity futures news service that features daily charts, a "coming events" calendar, model portfolio, market commentary, and more.
"The best way to learn about futures is to self-educate," Pearl says. "Read as much as possible and then open an account and lose some money. That way, you learn from your mistakes." He casts a negative eye toward paper trading (noting purchases and sells on paper without actually committing any money), which he believes only creates a false sense of security. "Everyone makes money paper trading," he says. "But when your hard-earned real money is at stake, all of a sudden, everything changes."
Futuresweb is in many ways a work in progress. Pearl is still looking to add more market news, information, and commentary, and is inviting brokerages and individuals to link their websites to Futuresweb. The website features a number of links, which provides infor-mation on commitment of traders, contract specifications, and other background data. But there is not the sort of "beginner's page" or introduction to futures trading that might make the learning curve a little less steep for the greenest of potential futures traders, although recommended readings lists, a glossary, and a tips-for-technicians section are worthwhile for beginners to review.
One section that is still under consideration - but may be well worth the wait - is Futuresweb's Broker Ratings page. Although not yet usable, the page hints at an extremely valuable addition not only for traders looking to find a good, reliable futures broker, but also for traders looking to switch from full-service to discount or online brokers. Pearl considers this page a key part of planned improvements to the site in the months to come.
In fact, Pearl plans for a "massive facelift" for Futuresweb in 2002. "It will be even easier and friendlier to use," he notes, "and we are planning on adding even more content." Pearl adds that, futures notwithstanding, he is currently studying for his Series 7 license, and says, "We may even add stock-related information." That's one more on the list of things to look forward to as Futureswebheads.
-David Penn, Staff Writer

Are you looking for stocks in a horizontal price channel? If you don't want to do the work on your own, you might consider the services of this website. But is it worth $10 a month to have someone else do your homework and send you 12 new charts each week?
When I first visited the website, I thought I wouldn't gain much out of it. Since it's a subscription service, I called them up and requested a complimentary account. My call was answered by one of the website's creators, although I didn't know it at the time. I started my usual train of questions, which included, "What are you doing to find the channels?" I expected to hear about the black-box, carry-to-my-grave, all-encompassing holy grail of price channel secret solutions.
But that's not what I got. The reply was a simple, "We look for chart patterns." Channelingstocks.com looks for a volatility of 10% to cover the support/resistance range, along with average daily volumes of 50,000 shares or more. The bid/ask spread should be a small portion of the support/resistance range, and if the spread is small, the average daily volume can go below 50,000 shares per day. When I examined its choices, I also found the website's powers-that-be look for equities that have gone through a peak or peaks. Not bad for people who have only been studying charts for a few years.
If you had done this on your own, you might have made the same choices; then again, you might not. The website displays some recent successful examples that seem typical, based on looking at some 30-plus recommendations that have been made for subscribers. One example is the Franklin Covey (FC) displayed in Figure 1. According to the website, this trade brought in a profit of $517.24. You won't find the support and resistance levels for this successful trade on the site, but based on a stop-loss order at $6.25 and a sell order at $8, you can see the likely choice for support is FC = $6.75, or possibly FC = $6.50 (solid and dashed blue lines), and resistance is FC = $8.00 (red line).
The vertical line in Figure 1 represents the date of the chart at the site, which in this case is April 27, 2001. A glance at the price history over the past year might have you thinking the price channel looks suspect. However, if you step back and look at the chart of FC over three years, the website's price channel looks more accurate (Figure 2). If you had followed its trading advice, you would have confirmed the upswing that started on May 8, 2001, on or around May 17 and bought at $7 or $7.25. And of course with a posting on or around April 27, the June dive would have been unknown. Channelingstocks.com checks the spread before making a recommendation, but keep in mind some choices lack liquidity. (Channeling stocks.com doesn't see a problem in the bid/ask spread.) In order to make the profit they propose, you would have bought close to 1,000 shares, which would almost make you a market-maker in this stock.
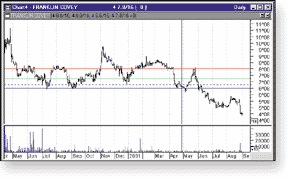
Figure 1: Franklin Covey (FC). Based on the advice of channelingstocks.com, the red line indicates resistance and the exit for long positions, while the green line represents the entry point for long positions. Blue lines are alternatives for support.
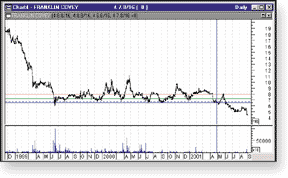
Figure 2: Three-year chart of Franklin Covey (FC). Here you see the price channel resistance at $8.00 (red line) and support at $6.75 (dashed blue line).
The trading advice provided is sound. It tells you to verify entry
for a long position by seeing that an upswing has started, to use protective
stops, and to get out when resistance is expected. I would have been long
on only two of the first 12 stocks I looked at using their trading suggestions.
Of their latest set of 12 recommendations (August 24, 2001), two have turned
down, nine are moving sideways, and one has gapped up. Given the bearishness
of the current market, this is pretty much what I would have expected.
SUMMERY
Channelingstocks.com is an honest effort, using reasonable criteria, to find stocks in a horizontal price channel. For $10 per month the website will pick 12 stocks per week for you to consider, and if it's worth $10 a month to have someone save you a few hours of work each week, then think seriously about this site.
- Dennis D. Peterson, Staff Writer
CROSS-CURRENTS.NET
This is an interesting site that uses a combination of fundamentals and technical analysis to make market predictions. Is the market currently too expensive? Cross-currents' answer is an overwhelming yes. The site has four areas you might find interesting: Mania Update, Short-Term Outlook, Commentary, and Chart of the Week. All four are written by Alan M. Newman.
Mania Update is updated about every six to seven weeks, and the other three sections every three to four weeks. It might sound like their news is old, but what makes Cross-currents interesting is the frequent use of intermarket data for analysis.
Mania Update: Ever wondered what is spent on goods and services versus stocks? A comparison (Figure 1) is provided in Mania Update, with supporting arguments. An additional eight charts with supporting arguments can be seen in a recent edition of Mania Update to make the point that the market is currently overextended. The mix of data includes advancing versus declining issues, 15-year annualized returns from 1912 to 2001, before and after portfolio allocations by leading market analysts, and a link to Louis Rukeyser's "Wall Street Elves" to point out that expert optimism has not been supported by market reality.
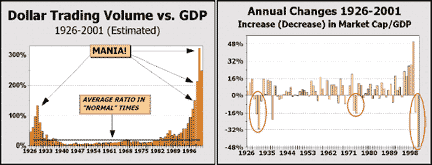
Figure 1: MANIA UPDATE CHARTS comparing dollar trading volume vs. GDP. For every dollar spent on goods and services, $249 is spent on stocks. From a historical perspective, this kind of spending was seen in the 1929 crash.
While you might not always agree with them, the data and arguments
are persuasive enough to provide a cautionary light for taking long positions,
at least for the moment.
Short-Term Outlook: A recent issue compares the 21-day moving average of Nasdaq total trading volume to the New York Stock Exchange (NYSE) to make the point that from a historical standpoint, the Nasdaq is seeing less trading volume relative to the NYSE. At the same time, the Nasdaq has become more volatile (Figure 2). Previous versions of the Short-Term Outlook were not available for review. But based on some of the commentaries I read, no sacred cows are above criticism.
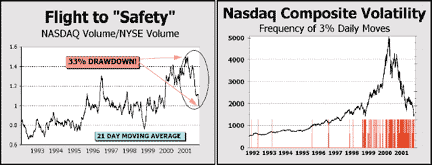
Figure 2: Ratio of Nasdaq to NYSE volume vs. Nasdaq volatility. The point is that investors are leaving the Nasdaq, while its volatility has simultaneously increased.
Commentary: This area is primarily textual, but graphs
and tables are included when appropriate. Now that more accurate reporting
is the rage because of government efforts, Cross-currents asks about statistics
that are published by the government. Is the pot calling the kettle black?
Cross-currents also takes the Purchasing Manufacturers Index to task. Make
no mistake; this is not just someone sounding off, but the voice of a concerned
investor trying to put today's events in context.
Chart of the Week: The cost of investing, relative to past history, is often emphasized. Ever wondered how a secular bull or bear market might be defined? You'll get a good definition in an article in this area with its link to a site. Market cycle and intermarket analysis are discussed here as well.
SUMMARY
While the site is updated fairly regularly, this information is not intended to be used for just today's trading strategies. The site also offers some food for thought and an authorial perspective born out of viewing the market for several years. I followed many of the links in the articles, and found some very interesting sites. I also found myself revisiting some sites I hadn't been to in years, but will need to look at periodically from now on. Overall, while I might not agree fully with all that is said, Cross-currents does make some arguments that are hard to ignore.
- Dennis D. Peterson, Staff Writer
Return to Table of Contents