CHARTING
About Those Ups And DownsCueing Off Support And Resistance Levels
by Thom Hartle
Tracking previous highs and lows and analyzing price action can provide clear indications of trend direction.Early in your trading career, you probably learned that you should buy at support and sell at resistance. Support is usually described as a previous point at which the market stopped going down, and resistance as the most recent high point at which the market stopped going up. A more definitive approach states that resistance is the previous week's high and support is the previous week's low. If you use trading signals for entry and exit points based on a shorter time scale, such as signals off the daily or intraday indicators in conjunction with weekly highs and lows, then you would be using a multiple time frame approach,as popularized by trader Robert Krausz.
And if you are trading intraday strategies, then view the daily highs and lows as the key support and resistance points. Drawing conclusions about the state of the market and price action based on support and resistance levels is a classic charting technique. In this article I'll look at weekly levels applied to a daily chart of the Standard & Poor's 500 futures contract to illustrate the value of this concept.
APPLYING IT
By looking to the previous week's high or low as support or resistance, you can determine the coming week's key levels, which gives you an idea of where to look to enter and exit the markets. If these levels are violated by a daily close past the weekly high or low, it can be considered the beginning of a trend. But how do you identify these key levels?
....Continued in the September 2002 issue of Technical Analysis of STOCKS & COMMODITIES
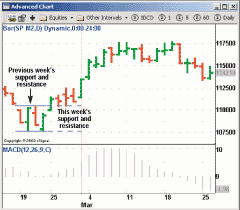 Figure 1: Weekly support and resistance levels. You can identify these by drawing trendlines across the previous week's high and low. The MACD histogram is helpful as confirmation.
Excerpted from an article originally published in the September 2002 issue of Technical Analysis of STOCKS & COMMODITIES magazine. All rights reserved. © Copyright 2002, Technical Analysis, Inc.
Return to September 2002 Contents