September 2002 Letters To The Editor
The editors of S&C invite readers to submit their opinions and information on subjects relating to technical analysis and this magazine. This column is our means of communication with our readers. Is there something you would like to know more (or less) about? Tell us about it. Without a source of new ideas and subjects coming from our readers, this magazine would not exist.
Address your correspondence to: Editor, STOCKS & COMMODITIES, 4757 California Ave. SW, Seattle, WA 98116-4499, or e-mailto Editor@Traders.com. All letters become the property of Technical Analysis, Inc. Letter-writers must include their full name and address for verification. Letters may be edited for length or clarity. The opinions expressed in this column do not necessarily represent those of the magazine. -Editor
PRICE TARGETS
Editor,
I thoroughly enjoy your mag and can't wait for the next issue each
month. How does one place price targets on any stock? What charts patterns
give the best probability of price predictions? Is there a book on the
subject dedicated to target setting/interpretation?
Yacoob Kadwa, via e-mail
According to Don Bright's Q&A column in the June 2001 Stocks & Commodities, "That is something the world would like to know," and he points out that the price-target predictions by analysts are usually not accurate. However, we have explored techniques for projecting price targets in several S&C articles that you may wish to check out, including:
Aston, Brent [1999]. "Applying Gann Angles To Computer Charts," Technical
Analysis of Stocks & Commodities, Volume 17: December.
Kahn, Michael [1997]. "Measuring The Move," Technical Analysis of
Stocks & Commodities, Volume 15: October.
Lloyd, Thomas K. [1993]. "Proactive Trading," Technical Analysis
of Stocks & Commodities, Volume 11: July.
Teseo, Rudy [2001]. "The Butterfly Setup," Technical Analysis of
Stocks & Commodities, Volume 19: April.
___________ [2001]. "The Gartley Setup," Technical Analysis of Stocks
& Commodities, Volume 19: January.
Past articles are available through the Online Store at our website, Traders.com.--Editor
EASE OF MOVEMENT
Editor,
Can you tell me where to find the ease of movement indicator? Can
it be used intraday? Which software package would I need to use it?
Jayne Berrier, via e-mail
You can find out about the ease of movement indicator from Richard Arms' book, Trading Without Fear. Many software packages include this indicator.--Editor
MARKET VS. INVESTED VALUATION
Editor,
I'm an amateur investor who is learning to keep a smile and cut my
losses and treat them as a learning experience. Nonetheless, I want to
do better, as difficult as that may be in the current conditions. As I
study and try to learn more, I find the standard accounting of the concept
market valuation rather dubious (in simplified form, number of shares outstanding
times current share price). This is because:
1) It reflects a theoretical total capitalization if all the shares
were sold at the last market price. Of course, because of price variability,
all the shares could not be sold at that price but would run down.
2) It does not reflect the actual amounts invested in the stock
by investors, or investor's market capitalization. But to track this, I
would have to know the previous purchase price of each share currently
being sold.
Is there any way I can find out this sort of data? If not, do you know of any mathematical model where I might be able to reasonably estimate this?
The attached image (Figure 1) shows what I mean. - Michael Ayres,
via e-mail, San Francisco, CA
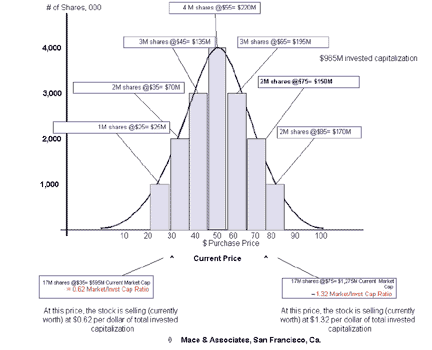
FIGURE 1: MARKET VALUATION
To the best of my knowledge, I don't know where you can find this data, mainly because it isn't something that is relevant to trading or technical analysis. Readers?--Editor
ELLIOTT WAVE PATTERNS
Editor,
Referring to the article by Rudy Teseo in the June 2002 S&C, "Recognizing Elliott Wave Patterns, " the two rules that Teseo is not aware of are:
1) The chart must look right. This is the first rule and should always remain the first rule. By this I am saying that if at any stage you are having problems in determining a wave count, then you are wrong. Put it aside, and look at it again the next day.
2) The standard Elliott pattern says that wave 3 cannot be shorter
than wave 1. This statement by Teseo is wrong.
- Jack Singer, Vancouver, BC, Canada
Good point regarding your first comment. Regarding your second, that sounds like a matter of opinion. According to Elliott, one hard and fast rule is that the third wave should never be the shortest of the three impulse waves (waves 1, 3, and 5). This is what Teseo stated in the article.--Editor
MARKET MAKERS
Editor,
I have a question for Don Bright of your "Q&A" column. I continue to read his comments in S&C with great interest.
Bright has referred to NYSE members trading against their customers, especially for market orders. I'm trying to figure how to get a reading on this, as one weekly setup parameter for other trading signals. Where may I find data to help me figure this out?
I've scrutinized Barron's weekly NYSE Member Report. This breaks it out by buy/sell volumes by specialist, floor trader, and other. (I don't know what the significance of "other" is.) The member activity as a percentage of total volume activity is something like 30% to 40%, and I'm not sure where the remaining 60% to 70% is coming from. I looked at Barron's data for block trades and program trading. There's also data for short sales (broken down by public, member, specialist, floor traders, and other members). Nothing seems to add up to 100%. I've asked Barron's for clarification a few times, to no avail.
But my basic question is, how can I get a reading -- on a weekly or daily basis -- on how much professional traders are betting against their customers? ?Kurb, via e-mail
Don Bright replies:
The practice of trading "against" customers is much more prevalent on the Nasdaq, due to the market maker system, wherein the market makers trade against their customers. The specialists act more as traffic cops -- and try to keep a "fair and orderly" marketplace. Depending on the brokerage you use, you may have the additional problem of having your orders filled in-house (that is, by the broker), or sold to another professional. You need to check your brokerage agreement.
In my opinion, the NYSE orders are treated fairly once they get there. When trading as a customer (versus trading as a professional trader), you are subject to the concerns mentioned, as well as possible timing problems. Market orders especially should be avoided when looking for a quick and fair fill on the NYSE. Limit orders will be given the "best price" anyway, so it makes sense to use them whenever possible.
RELATIVE STRENGTH INDEX
Editor,
In "A Closer Look At Divergences" by Clive Roffey in the July 2002 S&C, Roffey refers to the relative strength index (RSI) as a ratio of up days to down days. However, that is too simplistic. Roffey ignored a point about the number of days used in the RSI.
The number of days selected for RSI is more critical than is immediately apparent. The theory of runs suggests that six up days or six down days in a row is infrequent. More than 10 days in a row is very scarce indeed. There is a chance of finding a zero in the denominator or the numerator if you choose a period of less than 10. Suddenly, your finely crafted RSI is relative to nothing. In the process, RSI becomes indifferent as a trend-defining tool.
J. Welles Wilder found that 14 days was a practical solution. Wilder never intended RSI to be entirely a trend-following device. RSI improves on raw momentum or ROC (rate of change) by answering the question "how high is high" or "how low is low." The answer allows for comparisons between securities as well as making an adequate job of picking bottoms and tops. - Eric Russell, South Africa
BOOKS FOR BEGINNING FUTURES TRADERS
Editor,
Could you please tell me what book I could get that will teach me
about commodities? I want to learn how to trade in them. I see so many
different books, but I want a good beginners' book. Thanks.
J. Towler, via e-mail
You might try Jack Schwager's 1984 book, A Complete Guide To The Futures Markets, John Wiley & Sons. Beyond that, here are a few more classics on commodity trading and technical analysis:
Kaufman, P.J. [1998]. TheNew Commodity Trading Systems And Methods,
3d edition, John Wiley & Sons.
LeBeau, Charles, and David Lucas [1992]. Computer Analysis Of The
Futures Markets, Business One-Irwin.
Murphy, John J. [1991]. Intermarket Technical Analysis: Trading
Strategies For The Global Stock, Bond, Commodity And Currency Markets,
John Wiley & Sons.
_____ [1986]. Technical Analysis Of The Futures Markets, New
York Institute of Finance.
Schwager, Jack D. [1996]. Schwager On Futures: Technical Analysis,
John Wiley & Sons.
_____ [1995]. Schwager On Futures: Fundamental Analysis, John
Wiley & Sons.
ERRATA: TREND INTENSITY INDEX
Editor,
When inputting the Excel formula described in the June 2002 S&C article, "Trend Intensity Index," I am getting a circular relationship for column M. Is there a typo in the formula? -Joseph Italiano, via e-mail, Vaughan, ON, Canada
There is a circular reference in the last row of the last column. This can be corrected by changing A71 to A70 in the last row. Thanks for writing.--Editor
ERRATA: eSIGNAL TRADERS' TIP
Editor,
I really enjoyed the article in the July 2002 S&C by John Ehlers on zero-lag data smoothers.
However, when I attempted to use the eSignal version of the code for the zero-lag smoother as presented in the Traders' Tips column in the same issue, it did not work due to a typo. That is, a comment in the code must begin with /*. The FIR and IIR both have the problem. FIR should have begun:
/*************************************************
Description: This formula plots the Finite Impulse Response
Provided By: This formula was created in the eSignal Formula Editor
Copyright 2002 eSignal, A division of Interactive Data Corporation
*************************************************/
Likewise, IIR should have read:
/*************************************************
Description: This formula plots the Infinite Impulse Response
Provided By: This formula was created in the eSignal Formula Editor
Copyright 2002 eSignal, A division of Interactive Data Corporation
*************************************************/
Thanks for another fine issue.
Richard Salogub, via e-mail
Orlando, FL
When we published this code, the forward slash and the asterisks broke onto different lines because the line was too long to fit into one column, and we didn't notice the problem. Thanks for pointing it out.--Editor
Back to September 2002 Contents