March 2003 Letters To The Editor
The editors of S&C invite readers to submit their opinions and information on subjects relating to technical analysis and this magazine. This column is our means of communication with our readers. Is there something you would like to know more (or less) about? Tell us about it. Without a source of new ideas and subjects coming from our readers, this magazine would not exist.
Address your correspondence to: Editor, STOCKS & COMMODITIES, 4757 California Ave. SW, Seattle, WA 98116-4499, or E-mail to editor@traders.com. All letters become the property of Technical Analysis, Inc. Letter-writers must include their full name and address for verification. Letters may be edited for length or clarity. The opinions expressed in this column do not necessarily represent those of the magazine. -Editor
KONDRATIEFF WAVE
Editor,
From the first issue of STOCKS & COMMODITIES I picked up a year ago to the most recent issue, I have never been disappointed in the quality or content of your publication.
In the September 2002 S&C was an article on the Kondratieff wave by Tim Elrod, which I found interesting. However, I noticed that the chart showing the wholesale prices in relation to the idealized long wave was dated only till 2000.
Since we're now at the start of 2003, I was wondering where I could find an up-to-date chart like the one in the article?
In addition, I am curious as to whether STOCKS & COMMODITIES
has ever or will ever be running an article on the technical view of commodity
price and inventory?
Robert Herbst, via e-mail
Tim Elrod replies:
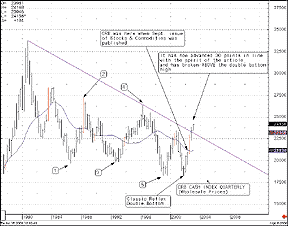
Pictured in Figure 1 is an updated CRB quarterly chart, although I don't know where you can find this type of information for free on the Internet.
The Foundation For The Study Of Cycles [which is now defunct-Ed.] picked up on the K-wave idea in the late 1980s and early 1990s, but most of my information came from foreign periodicals while at [University of California at] Berkeley in the early 1970s.
I hope to contribute more articles on the long wave to S&C soon.

FIGURE 1: Kondratieff wave ON CRB INDEX. This chart shows wholesale prices in relation to the idealized long wave through mid-January 2003.
S&C Publisher Jack Hutson replies:
With regard to commodity prices and inventory: Commodity prices are easy to find historical data on, but reliable up-to-date information on the available quantity of an actual commodity is difficult to obtain. It is evident that price is based on demand for a product, and that demand is based, in part, on the available product in inventory.
STOCKS & COMMODITIES has published many articles about the relationship of commodity prices to inventory of the underlying commodity. Inventory is usually represented by proxy. Most articles study the commodity price versus cash or spot price - the difference between the two referred to as the basis. Some articles have also analyzed the price relation to Commitment Of Traders Report data published by the Commodity Futures Trading Commission (CFTC). Some study the relationship of the futures price to contract open interest.
Back-issue articles can be purchased from the Online Store at our website, Traders.com. To help locate an article, use the search engine at our website, or use the full-text search utility on our S&C on CD.-Publisher
MORE EXCEL SPREADSHEETS
Editor,
The reason I have not subscribed to STOCKS & COMMODITIES is that
you do not give us Microsoft Excel spreadsheet applications. You give some
code for various stock-picking software, but you need to also provide Excel
spreadsheet workups. In that way, we would not have to buy two or three
of the stock-picking software programs out there to use your magazine.
I would subscribe if you did that.
Scott A. Mehring
Camp Hill, PA
We encourage our authors to codify their techniques as much as possible and include that code in their article. Naturally, that format will usually be in whatever program the article's author is using. However, many past S&C articles have included a sidebar giving Excel code, often put together by the editor as time permitted.
In addition, we include a Traders' Tips column in each issue, in which vendors of various technical analysis software codify a technique in the magazine and present it in their program's language. All previous Traders' Tips are available to the public at our website, Traders.com.-Editor
ADVISORY SERVICES
Editor,
Have you recommended any advisory services in your magazine? It is
hard to find a well-performing one and one whom you can trust. Do you have
any suggestions? A couple of months ago I read about some advisory service
on your site. They used neural networks and said they did very well. Do
you remember this company?
Patrik, via e-mail
Sweden
We don't make recommendations in STOCKS & COMMODITIES, neither for specific securities nor for specific advisories or other services. For help with choosing an advisory service, we suggest you visit the SEC's website at www.sec.gov, which offers some guidelines for selecting products and services, and also the National Futures Association's website at www.nfa.futures.org, which offers background information on companies and services related to the futures industry called the Background Affiliation Status Information Center (BASIC).
At our own website, Traders.com, we offer a database of products and services called the Traders' Resource. Here, you will find listings of products and services in different categories. However, it is simply a listing, and products and services are not ranked or rated in any way.-Editor
SHORT INTEREST
Editor,
I just discovered your website while doing a search on the term
"investing technical analysis." I didn't have time to thoroughly check
out your site, but my first impressions were good, so I plan to return.
Meanwhile, I have a question.
I don't yet know much about using technical analysis, but when I visit some message boards on investing in certain stocks, I see that many people swear by such analysis, and your website confirms this idea.
One topic that keeps coming up in the messages is short interest. I know the basics about people who make their money by shorting stocks, trying to avoid squeezes, and so on, but I don't understand how the short interest can be analyzed. I've looked at some charts of short interest, ratios, etc., but they don't tell me anything (at least nothing that I can currently understand). I also can't find any tutorials on the subject on the Internet. I also can't tell if any of the many systems linked to your site make any use of short interest.
Do you have any recommendations for books or classes on technical
analysis, including analysis of short interest?
Lynn, via e-mail
See the article "Short Interest" by Arthur A. Merrill (STOCKS & COMMODITIES, Volume 7:2), available from the Online Store at our website, Traders.com. In addition, here are some other articles published in S&C over the years that discuss short interest:
Erlanger, Phil [1991]. "Short Interest And Level Of Pain," sidebar,
Technical Analysis of STOCKS & COMMODITIES, Volume 9: December.
Lawlor , John C. [1988]. "Volume Analysis, part 1," Technical Analysis
of STOCKS & COMMODITIES, Volume 6: January.
Merrill, Arthur [1992]. "Odd-Lot Shorts," sidebar, Technical Analysis
of STOCKS & COMMODITIES, Volume 10: October.
Merrill, Arthur A. [1989]. "Member And Public Short Selling,"
Technical
Analysis of STOCKS & COMMODITIES, Volume 7: April.
Meyers, Dennis [1997]. "A Daily A-D New High-New Low Market System,"
Technical
Analysis of STOCKS & COMMODITIES, Volume 15: January.
Sweeney, John [2000]. "Yale Hirsch: Market Historian," interview,
Technical
Analysis of STOCKS & COMMODITIES, Volume 18: December.
In addition, visit the Courses & Seminars category of our Traders' Resource feature at our website, Traders.com, for a listing of courses and seminars and some of the topics they cover.
Finally, as for books that cover the topic of short interest, try the classic:
Colby, R.W., and T.A. Meyers [1988]. The Encyclopedia Of Technical
Market Indicators, Dow Jones-Irwin.
-Editor
4% SOLUTION
Editor,
I just read with interest David Penn's excellent article in the December
2002 S&C, "Revisiting The 4% Solution." How about trying one simple
little change that might improve results: Instead of looking at the end
of each week to see if there's a 4% signal, how about looking at the end
of every day? The idea is to look back five trading days at the end of
each day. I wonder if Penn has tried this?
David G. Hawkins
Newton, MA
David Penn replies:
No, I have not tried looking at a rolling five-day period. I know part of what Martin Zweig appreciates about the 4% model indicator is its ease of use, and a rolling five-day period would take relatively more work. There are a number of variations that seem possible, as you suggest, ranging from changing the time period (or changing the way the time period is calculated, as in your example) to changing the percent change number from 4% to 3% or even 5%.
Thanks for writing, and let us know if you'd be interested in sharing any of your results should you pursue it.
INVESTING IN WARRANTS
Editor,
I have visited your website, Traders.com. I am looking for expert advice and info on investing in warrants.
1. Can you suggest any sources (books, articles, or online courses)
to learn about warrant investing?
2. What is Nurock's formula and its usage?
Ho Lai Man, via e-mail
For books on investing in warrants, try searching at the sites of some of the online booksellers. Sorry, we haven't published articles specifically on warrant investing.
We interviewed Robert Nurock in our April 1991 issue ("All By His Elf: Robert Nurock"), although warrants weren't discussed.-Editor
TRADING THE E-MINI
Editor,
I was both excited and disappointed to discover the article "Trading The E-Mini" by Dennis Meyers in your January 2003 issue. A title like this goes straight to my field of interest and probably that of many other readers.
However, even though the article is themed "Trading Techniques," it turns out that it does not contain the necessary details that would enable a reader to implement the technique. Instructions such as, "Do an inverse FFT on the noise-filtered spectrum" are hardly sufficient and will at least require a lot of additional research on the reader's part. Note that I'm not complaining about the complexity of the matter, just that the article provides no way for me to replicate the technique.
Since it was obvious that the author had used TradeStation for his work, I expected to find EasyLanguage code either in the article or on your website. This is normally the case. Because it wasn't there, I contacted the author. He informed me that not only is the EasyLanguage code not available for free, but also that the computations described in the article are performed by a C++ Dll. Describing the programming of a Dll would clearly be beyond the scope of your magazine. In fact, this article describes a trading system that the author is selling for $495! In other words, this is actually a product review, written by the vendor!
I think product reviews are an important part of your magazine, but
they should of course be authored by independent journalists. And in any
case, using almost seven pages for a product review would be on the long
side. I would prefer them to be shorter, so that more space could be used
on techniques that I actually can implement and work with, straight from
the article. I hope you'll establish quality routines that prevent articles
like this one from appearing in the future, or at least clearly mark them
as product reviews.
Willy Verwoerd
Oslo, Norway
This article wasn't a product review; the author discusses his technique
by disclosing his methodology.
I recommend that you look at Meyers's previous article, which appeared
in the May1999 issue of STOCKS & COMMODITIES, for more details. That
article was listed in the References section at the end of Meyers's January
2003 article. Back-issue articles can be purchased from the Online Store
at our website, Traders.com.-Editor
ERRATA: DOGS OF THE DOW
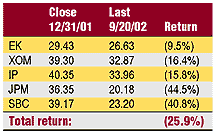
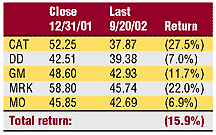
Figures 2 and 3 in my article, "Bear-Baiting & The Dogs Of The Dow," which appeared in the January 2003 STOCKS & COMMODITIES as well as the October 8, 2002, edition of our Working Money online magazine, were based on some inaccurate data. The corrected tables are shown here.

FIGURE 2: Lowest-priced/Highest-yielding stocks in the DJIA

FIGURE 3: Highest-priced/Highest-yielding STOCKS IN THE DJIA
Interestingly (and fortunately), the percentages in terms of the two strategies remain almost identical, as do the conclusions in the text of my article.-David Penn, Staff Writer
Back to March 2003 Contents