Explore Your Options
| Got a question about options? Tom Gentile is the chief options strategist at Optionetics (www.optionetics.com), an education and publishing firm dedicated to teaching investors how to minimize their risk while maximizing profits using options. To submit a question, post it on the STOCKS & COMMODITIES website Message-Boards. Answers will be posted there, and selected questions will appear in future issues of S&C. |

Tom Gentile of Optionetics |
FLEX OPTIONS
What are FLEXoptions?-A.M.
Flexible exchange (FLEX) options are totally customizable equity and index options that you can create under certain requirements. They allow traders complete flexibility to create option contracts at unorthodox strikes, expiration dates, and styles (American or European). These kinds of contracts have a minimum trade size of 250, so generally the small trader isn't partaking in the advantages these instruments offer.
The reasons why you would customize an option contract vary from trader to trader. An example of one of the best uses for them is to create a conversion (protective collar), a risk-free position using strikes that are right at-the-money regardless of where the stock is. Say, for example, CSCO is trading at $14, and you own 25,000 shares. You could create a conversion using FLEX options by creating and purchasing 250 puts with a 14 strike and selling 250 calls, also with a 14 strike.
Further, you can make the puts European style and the calls American style. American-style options are more expensive than European style; if you can sell the calls for more premium than you pay for the puts, you've guaranteed yourself a risk-free profit from the difference, while simultaneously protecting yourself from a downside move in the underlying instrument.
READING A RISK CURVE
Could you please educate me on how to read a risk curve? Thanks-Marshall
As an options trader, you must understand risk curves, since they can provide you with a road map of your trade. They do this by telling you where your profit or loss in a position may be, given a change in one of the many components of an option's value, such as price change in the underlying, time decay, and changes to implied volatility. Most risk curves seen in books and magazines display at least one time frame - that of expiration of the option itself. This, however, is rarely enough information to make a decision about entering a trade.
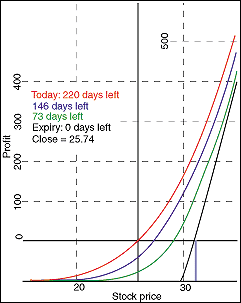
Take a look at the risk curve taken from our Platinum software (Figure 1) of a long call on SBC with a strike price of 30 for $1 taken on June 10, 2003. Each of the colored lines represents the profit or loss of the position respective to the stock price at various points in time, starting from today (red line) on through to expiration (black line). The vertical axis is notated by the actual profit and loss numbers in increments of $100, while the horizontal axis is notated by the price of the stock.

Figure 1: Risk curve. Here's a risk curve of a long call on SBC with a strike price of 30. Each of the colored lines represents the profit or loss of the position respective to the stock price at various points in time, starting from today (red line) on through to expiration (black line).
If today (red line) the stock were to rise to $30, the profit in this position would be approximately $180, as noted by the vertical axis of the chart. As you can see by the black line, if SBC were to close at $30, there would be no profit. For this position to have a $180 profit at expiration, the stock would need to finish at $32.80, a $2.80 difference!
This is the nature of time decay in an option, and it is a phenomenon that can be easily understood through the use of computer-generated risk curves such as this one. Can you see what would happen to the value of the position today if the stock were to drop to $20? It would lose about $80, or 80% of its value. Why would this be important to you as a trader? Suppose you maintain a stop-loss of 50% of the value of your positions. You could determine the price the stock would need to be at for your position to be down 50%. According to the risk curve, were the stock to drop to $23 on that day, the value of your position would drop to $50, and thus your 50% stop-loss would be hit.
By no means are risk curves the end of the option trader's due diligence. However, they should be a necessary step in setting up a good trade. Oftentimes, a trader will prevent huge losses by paying attention to whether the trade looks good just by the risk curve alone.
Optionetics Platinum
Return to August 2003 Contents
Originally published in the August 2003 issue of Technical Analysis
of STOCKS & COMMODITIES magazine.
All rights reserved. © Copyright 2003, Technical Analysis,
Inc.