Can Gaps Make You Money?
Gauging Gaps
by Thomas N. Bulkowski
Should you trade the gap? Here are some gap performance numbers to help you decide.
Suppose you've been following a chart pattern. Say prices gap upward, piercing the trendline in a breakout. Do you buy the stock, expecting an unusually large gain? How long will it be before prices return and close the gap? I will address those questions here.
GAP TYPES
Prices gap when today's high is below yesterday's low, or today's low is above yesterday's high. A chart of the pattern will show a gap between the prices.
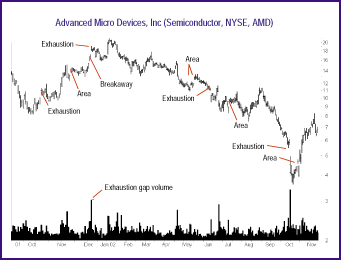
There are five types of gaps: area, breakaway, continuation, ex-dividend, and exhaustion. Figures 1 and 2 show examples. Common and pattern gaps are synonyms for the area gap. As you can see in Figure 1, area gaps appear most often, usually during a sideways price trend. Prices usually, but not always, close the gap quickly, meaning that they return to the gap location and span it completely, filling the hole left by the gap. For example, the area gap in November closes a week later, but the early December breakaway gap doesn't close until almost February.

Figure 1: Area, breakaway, and exhaustion gaps. Area gaps are the most common, with breakaway gaps giving the best performance.
Exhaustion gaps typically appear at the end of a straight-line run, as they did in December and October. Measuring and runaway gaps are synonyms for the continuation gap. Figure 2 shows an example. It's a rare gap, and it too makes its appearance during straight-line runs, with prices continuing to move in the prevailing direction.
...Continued in the September 2003 issue of Technical Analysis of STOCKS & COMMODITIES
Excerpted from an article originally published in the September 2003 issue of Technical Analysis of STOCKS & COMMODITIES magazine. All rights reserved. © Copyright 2003, Technical Analysis, Inc.
Return to September 2003 Contents