INDICATORS
The Infinitely Useful FVE
Detecting Breakouts In Intraday Charts
by Markos Katsanos
Here's an important enhancement to the finite volume elements indicator that's especially useful with intraday minute charts.
In the April 2003 STOCKS & COMMODITIES, I introduced the finite volume elements indicator (FVE) and demonstrated how it can be used to detect breakouts in daily charts. To refresh your memory, the FVE is a money flow indicator, but it has two important innovations: first, the FVE takes into account both intra- and interday price action, and second, minimal price changes are taken into account by introducing a price threshold.
Those innovations were introduced to improve on two important limitations of existing money flow indicators:

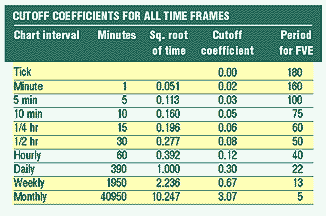
Figure 1: The third column displays the square root of time relationship between different time intervals. The fourth column displays the proposed cutoff coefficients for the old FVE formula only. These are not to be used with the new volatility-enhanced formula. The fifth column displays the proposed time span (in bars) for FVE and for different time interval charts.
...Continued in the September 2003 issue of Technical Analysis of STOCKS & COMMODITIES
Excerpted from an article originally published in the September 2003 issue of Technical Analysis of STOCKS & COMMODITIES magazine. All rights reserved. © Copyright 2003, Technical Analysis, Inc.
Return to September 2003 Contents