INDICATORS
Get A Feel For The Markets
Index Of Chart Sentiment
by Viktor Likhovidov
This new concept can improve your intraday trading.
Those who trade stocks or derivatives may rely upon a number of so-called sentiment indicators such as the put/call ratio, the number of odd-lot sales, and the number of investment advisors who are bullish versus bearish. These indicators can give useful hints about the plans and intentions of market participants. But currency traders have no such additional indicators, and the only source of information is the price chart itself. In this article, I will discuss the index of chart sentiment, a new approach that can improve your intraday trading systems.
INTRADAY TRADING AND ITS PROBLEMS
Any trader who attempts to trade short time frames learns quickly that common technical analysis and money management rules alone will not make his trading successful. One of the universal rules in trading is the old saying, "The trend is your friend." A trend is formed when the market undergoes some evident movement. Buying the trend is a natural reaction, as is immediately taking a loss if the trend reverses. Another well-known statement about the markets is that any rally will inevitably be accompanied by a pullback of some degree. Just when you are ready to buy, others are beginning to sell. This causes the market to retreat, and may cause your stop-loss to be executed. Those who have finished selling will buy again, and the trend resumes. Sound familiar?
Detecting new trends during their early stages can certainly aid in efficient trading. But doing so is difficult, mainly because the price chart is really a lagging indicator of the trend. When the market begins to show a turnaround, you don't know whether the trend is reversing or if the move is merely a retracement. When the trend reasserts itself, it is usually too late and too dangerous to join it.

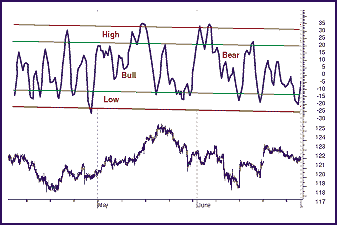
Figure 1: index of chart sentiment. Here you see how the index performs on the hourly chart of the yen during April-June 2000.
...Continued in the September 2003 issue of Technical Analysis of STOCKS & COMMODITIES
Excerpted from an article originally published in the September 2003 issue of Technical Analysis of STOCKS & COMMODITIES magazine. All rights reserved. © Copyright 2003, Technical Analysis, Inc.
Return to September 2003 Contents