CHARTING
The Power Of Observation
Daytrading The E-Mini With Point & Figure
by Eugene Steele
Here's a look at how you can trade the e-mini with a classic charting technique.
Point & figure charting has been largely ignored as a tool for daytrading, but it is actually one of the most powerful techniques for successful daytrading and a major tool for new traders. Whenever I show a trader a chart, the first question I ask is, "What do you see?" One of the skills of a good trader is the ability to see something on a chart that others don't notice. That might mean spotting simple things such as which days of the week or month act in a particular way. For example, you might try to notice the relationship of price to trend changes: Can a change in trend ever occur to the upside if the close is below the open? Can it occur on the downside if the open is above the close? If you trade the same stock in various time periods, look for consistencies. Point & figure charts can aid you in making these types of observations.
POINT & FIGURE CHARTING
Point and figure charting was the method traders first used to track the US stock markets, and it has gone in and out of favor over the years. P&F is a simple method of following price action (see the sidebar, "Point & figure technique," for a refresher on using the method). Basically, a box size is defined to be equal to a specific price shift. When price moves by the designated amount, an X is drawn in the box. Should the price move down by that amount three times (a generally accepted number), a circle or square is drawn to indicate a price reversal.

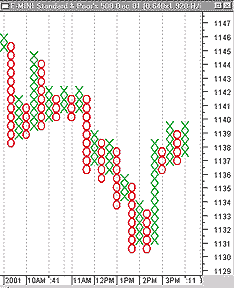
Figure 1: one-minute point & figure chart. The software has automatically selected a box size of 0.64 and a price field using high/low range. These parameters will not fit our trading, and they violate traditional point & figure methods.
I was introduced to point & figure charting about 50 years ago. The trader who showed it to me is now 87, and still uses P&F charts very profitably. Let's take a look at the method and some charts.
...Continued in the September 2003 issue of Technical Analysis of STOCKS & COMMODITIES
Excerpted from an article originally published in the September 2003 issue of Technical Analysis of STOCKS & COMMODITIES magazine. All rights reserved. © Copyright 2003, Technical Analysis, Inc.
Return to September 2003 Contents