CHARTING THE MARKET
TRIX
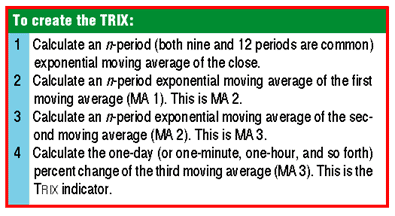
Long, long ago, in a bull market era that now seems far, far away (that is, 1983), a technical analyst by the name of Jack K. Hutson was trying to tease out of his computer a solution to the "drudgery" of trading. As he wrote in Technical Analysis of STOCKS & COMMODITIES, the new magazine he had begun publishing mere months before:
I always felt that by taking just a little time, and cranking out just one more wonderful oscillator or average, that my chances for a profitable trade would be improved. In most cases all I did was reassure myself that I had examined most every "system" in my personal repertoire, but I had no idea whether this had actually improved my trading. The one thing I was very sure about was that the time and effort required to make a trade decision had jumped from minutes to hours. It was taking some of the fun out of trading.
The title of the article was "Good TRIX and the solution Hutson discovered -- in collaboration with colleague Anthony Warren -- was a way to spot market turns without getting caught up in the excess price action "noise" of the marketplace, noise that often resulted in false breakouts and other frustrating market moves. He called this new solution TRIX, after the triple exponential smoothing that is the cornerstone of the indicator's effectiveness, and went on to write a variety of articles and commentaries on both the development and application of this momentum-oriented indicator.

How does the TRIX work? Most traders and investors using the TRIX indicator generally look for the indicator to move above or below a "zero line" in order to determine buying or selling opportunities, respectively. However, some traders prefer to use a "trigger line" that is essentially a slower- or faster-moving TRIX indicator instead of the zero line. Still others look for divergences between the movement of the TRIX and price action itself (for example, a rising Trix with falling price action could be considered as a positive -- bullish -- divergence).
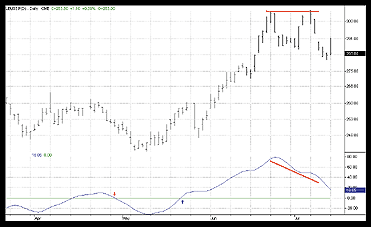
Take a look at the chart of the TRIX and the September lumber futures contract. It shows two ways the TRIX can be used to help interpret price action. First, note how little zigzagging or whipsawing there is in the indicator itself over the period from April 2003 to July 2003. This is one of the benefits of the triple smoothing in the TRIX. Note the down arrow (red) in late April where the TRIX crosses beneath the zero line. At the same time, price action in the lumber contract is breaking down. Conversely, in late May, the up arrow (blue) where the TRIX crosses above the zero line points to lumber prices that are rebounding strongly. Again, consider the effect of the triple smoothing. When lumber prices pull back sharply in late May, the TRIX -- rather than diving back below the zero line and perhaps providing a false exit (or worse, short) signal -- simply levels out. Lumber resumes its advance shortly thereafter, with the TRIX soaring higher right along with it.

Note also when September lumber makes a pair of peaks in late June and early July. Although these peaks are more or less at the same level, the TRIX indicator drops off sharply from the first peak to the second peak. This is a classic example of a negative divergence in which prices advance or remain flat, while an indicator turns bearish (in this case, moving downward).
--David Penn, Staff Writer
Learn more about the Trix!
Achelis, Steven B. [1995]. Technical Analysis From A To Z,
Probus Publishing.
Hutson, Jack K. [1983]. "Good Trix," Technical Analysis of STOCKS
& COMMODITIES, Volume 1: July/August.
_____ [1984]. "TRIX: Triple Exponential Smoothing Oscillator," Technical
Analysis of STOCKS & COMMODITIES, Volume 2: March.
Luisi, Joe [1997]. "Playing TRIX: The Triple Exponential Smoothing
Oscillator," Technical Analysis of STOCKS & COMMODITIES,
Volume 15: June.
Penn, David [2002]. "TRIX Is For Traders," Technical Analysis
of STOCKS & COMMODITIES, Volume 20: March.
Warren, Anthony W. [1983]. "Further Analysis Of Triple Exponential Smoothing,"
Technical Analysis of STOCKS & COMMODITIES, Volume 1: September/October.
_____ [1994]. "Optimizing Momentum," Technical Analysis of STOCKS
& COMMODITIES, Volume 12: April.
--TradeStation (TradeStation Technologies)
Originally published in the September 2003 issue of Technical Analysis of STOCKS & COMMODITIES magazine. All rights reserved. © Copyright 2003, Technical Analysis, Inc.