ANATOMY OF A TRADE
Dear Diary, Timing Is Everything
The CCI Trade
by Thomas N. Bulkowski
It's not when you buy but when you sell that counts. These two trades used the commodity channel index as a sell signal.
Many traders will tell you it's easy to buy a stock but difficult to sell. When you sell determines whether you make a profit or a loss. A buy and hold strategy in a rising market is a winning strategy -- until the trend changes. After that, holding on too long leads to reduced profits and even losses. So when do you sell?
The easy answer is that you should sell when prices reach their maximum, but determining that point takes skill and luck. I rarely hit the peak, and sometimes don't even come close. Sometimes, just getting out with a profit is a blessing.
FLYING HIGH WITH CCI
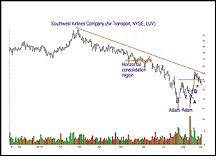
Figure 1 shows the first two buy points in Southwest Airlines [LUV]. The first trade occurred on August 16, 2002 (point A), and this is my notebook entry for that trade:
8/16/02: I bought 800 shares at the market open, filled at $12.45. I think this has bottomed even though United Airlines [Ual] might go bankrupt. It appears that this might be an Adam & Adam double bottom, provided prices climb above confirmation. That might be tough in the short term as the market is nervous and airlines are hitting turbulence. I'll buy more if this descends to 11 or so, maybe in November, then pray for a rise into the spring as airlines usually take off over that time.

Figure 1: The first trade. An Adam & Adam double bottom sets up the first trade.
How do you identify an Adam & Adam double bottom (AADB)? Look for a downward price trend leading to a twin-bottom pattern. The twin-bottom lows should look like they are at or near the same price, say within 4% of each other (Figure 1 shows a price difference of just 2%). The rise between the two bottoms should be 10% or more (the figure shows a 28% rise from 10.90 to 13.90). Time separation between the two lows should be at least three weeks (the figure shows a 21-day separation). Finally, look for two downward price spikes like those shown, not rounded turns. In short, the bottom should look like a sharp, V-shaped double bottom. If there is any doubt, skip it and look for the next pattern.
...Continued in the November 2003 issue of Technical Analysis of STOCKS & COMMODITIES
Excerpted from an article originally published in the November 2003 issue of Technical Analysis of STOCKS & COMMODITIES magazine. All rights reserved. © Copyright 2003, Technical Analysis, Inc.
Return to November 2003 Contents