STATISTICS
Can You Profit From The Tick?
Does The Market Have A Personality?
by James Kellndorfer
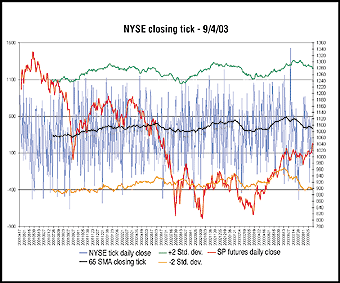
Here's a look at how you can convert the NYSE's tick into a sentiment indicator using statistical analysis.
Along with the other US stock exchanges, the New York Stock Exchange (NYSE) provides investors with an internal statistic of the stock market called the tick. This statistic summarizes the number of stocks that are increasing in price versus those that are decreasing in price. But what does this really mean and how can you use this information in a meaningful way?
THE TICK
Generally, many view the tick as the amount of buying or selling taking place in the market, but that isn't quite accurate. This is because there's a seller for every buyer. Both sides are represented simultaneously at any given price. This view is accepted in the futures market and is generally referred as a zero sum market. But how is a trader to know how much supply remains at any given moment?
As orders are matched and executed, shares are being bought and sold simultaneously, but how many shares remain in the specialists' books for trading? You can look up the number of shares outstanding and the float, but where is the actual remaining supply reported for each trading day? This information isn't available to the individual trader currently, but it is available for the specialist. Not knowing the true supply numbers makes it harder to evaluate the effect of volume on price. Again, you can see the result by reviewing the quote at the end of the day, but anticipating the effect would be easier if this knowledge were disseminated to everyone.

...Continued in the November 2003 issue of Technical Analysis of STOCKS & COMMODITIES
Excerpted from an article originally published in the November 2003 issue of Technical Analysis of STOCKS & COMMODITIES magazine. All rights reserved. © Copyright 2003, Technical Analysis, Inc.
Return to November 2003 Contents