CHARTING
Bear-y Significant Patterns
Identifying Bearish Chart Patterns (I)
by Thomas N. Bulkowski
Bearish chart patterns form at the top of a bear market. What do they look like?
Since March 2003, the market has been trending upward. As I write this in August 2003, I'm starting to see bearish chart patterns dotting the stock market landscape like storm clouds brewing. What should you know about bearish chart patterns? This two-part article takes a close look at them.
BROADENING FORMATION, RIGHT-ANGLED AND ASCENDING
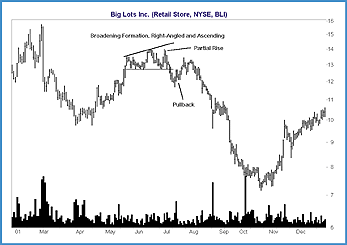
Figure 1 shows a right-angled and ascending broadening formation. Prices along the bottom of the pattern follow a horizontal trendline; along the top, a trendline connects higher highs. Thus, the pattern broadens out, but only on the topside. The pattern portends a bearish price reversal. In this example, prices started climbing in late March, entered the pattern, then tumbled after the breakout, reversing the short-term uptrend.

Figure 1: Right-angled and ascending broadening formation. A partial rise in this chart pattern correctly predicts a downward breakout.
A key to this pattern and other broadening patterns is the partial rise. If prices touch the bottom trendline and climb but don't touch the upper trendline, then there is a good chance that prices will break out downward. I call that hump a partial rise because prices partially make their way across the pattern. Look for partial rises after four touches of the trendlines occur (at least two on each side). Only then is a partial rise valid.
As a bearish chart pattern, the right-angled and ascending broadening formation isn't very bearish. Although prices can tumble, as shown in Figure 1, the average decline measures 18% for the 181 patterns I looked at. That's shy of the average 21% decline for other bearish chart patterns.
...Continued in the December 2003 issue of Technical Analysis of STOCKS & COMMODITIES
Excerpted from an article originally published in the December 2003 issue of Technical Analysis of STOCKS & COMMODITIES magazine. All rights reserved. © Copyright 2003, Technical Analysis, Inc.
Return to December 2003 Contents