TRADING TECHNIQUES
Nani Desu Ka?*
Using The Heikin-Ashi Technique
by Dan Valcu
Enter and stay on the right side of the trend -- or when in doubt, stay out -- with this Japanese charting technique.
Since the introduction of the candlestick method to the US some two decades ago, it caused a revolution in perceiving how the bullish and bearish forces perform in the Western markets. It has become a popular charting tool, as traders have used candlesticks to make chart formations easier to spot and name. But interpreting candlesticks can be challenging. To make things easier, the heikin-ashi technique modifies the traditional candlestick chart. Let's take a look at how it works.
BALANCING ON ONE FOOT
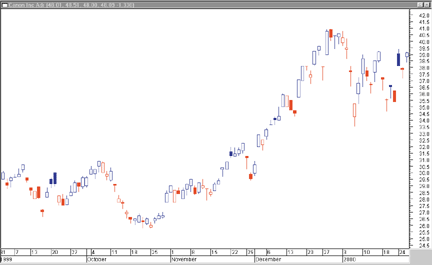
The heikin-ashi method (heikin means "average" or "balance" in Japanese, while ashi means "foot" or "bar") is a visual technique that eliminates irregularities from a normal chart, offering a better picture of trends and consolidations. Just by looking at a candlestick chart created with this method, you get a good idea of the market's status and its strength. Take a look at the candlestick chart of Canon ADR in Figure 1A versus the heikin-ashi modified chart in Figure 1B. Which chart would you prefer to use?
CALCULATION
The heikin-ashi candlestick technique uses modified open-high-low-close (OHLC) values and displays them as candlesticks. The modified values are computed using these definitions:
haClose = (O+H+L+C)/4 haOpen = (haOpen (previous bar) + haClose (previous bar))/2 haHigh = Maximum(H, haOpen, haClose) haLow = Minimum(L, haOpen, haClose)
The "open," "high," "low," and "close" referred to are of the current bar. The prefix ha- indicates the corresponding heikin-ashi modified values. I have used daily data throughout this article, so one bar represents one trading day. Depending on the trading time frame, you may employ other data, such as intraday, weekly, or monthly.
The value haOpen is always set to the midpoint of the body of the previous bar, while haClose is computed as the average price of the current bar. The modified high, haHigh, is chosen as the highest value of the set {real high (H), modified open (haOpen), and modified close (haClose)}. The same logic applies to the definition of the modified low: It is the lowest value in the set {real low (L), modified open (haOpen), and modified close (haClose)}.
The first sidebar, "Heikin-Ashi Ohlc Values," details how to compute heikin-ashi values using Excel.

FIGURE 1A: DAILY CHART OF CANON. This is the traditional candlestick chart of Canon.
...Continued in the February issue of Technical Analysis of STOCKS & COMMODITIES
Excerpted from an article originally published in the February 2004 issue of Technical Analysis of STOCKS & COMMODITIES magazine. All rights reserved. © Copyright 2004, Technical Analysis, Inc.
Return to February 2004 Contents