February 2004
TRADERS' TIPS
You can copy these formulas and programs for easy use in your spreadsheet or analysis software. Simply "select" the desired text by highlighting as you would in any word processing program, then use your standard key command for copy or choose "copy" from the browser menu. The copied text can then be "pasted" into any open spreadsheet or other software by selecting an insertion point and executing a paste command. By toggling back and forth between an application window and the open Web page, data can be transferred with ease.
This month's tips include formulas and programs for:
or return to February 2004 ContentsTRADESTATION: Heikin-Ashi Technique
AMIBROKER: Heikin-Ashi Technique
eSIGNAL: Heikin-Ashi Technique
AIQ EXPERT DESIGN STUDIO: Heikin-Ashi Technique
WEALTH-LAB: Heikin-Ashi Technique
NEUROSHELL TRADER: Heikin-Ashi Technique
NEOTICKER: Heikin-Ashi Technique
TRADINGSOLUTIONS: Heikin-Ashi Technique
INVESTOR/RT: Heikin-Ashi Technique
TECHNIFILTER PLUS: Heikin-Ashi Technique
STOCKWIZ: Heikin-Ashi Technique
FINANCIAL DATA CALCULATOR: Heikin-Ashi Technique
![]() TRADESTATION: Heikin-Ashi Technique
TRADESTATION: Heikin-Ashi Technique
Dan Valcu's article in this issue, "Using The Heikin-Ashi
Technique," describes a method of drawing Japanese candlesticks
and two simple indicators based on them. Here is the EasyLanguage indicator
code for the tools that Valcu describes:

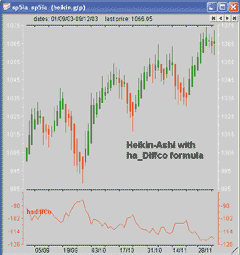
FIGURE 1: TRADESTATION, HEIKIN-ASHI TECHNIQUE. This sample TradeStation chart shows the haOpen and haDiff indicators on a heikin-ashi candlestick chart.
Indicator: Heikin Ashi
inputs:
 ShadowColor( White ),
 ShadowThickness( 5 ),
 UpBodyColor( Green ),
 DownBodyColor( Red ),
 BodyThickness( 3 ) ;
variables:
 haClose( 0 ),
 haOpen( 0 ),
 haHigh( 0 ),
 haLow( 0 ),
 TrLinIDLoHi( 0 ),
 TrLinIDOpCl( 0 ),
 SizeFuncRtn( 0 ),
 ColorFuncRtn( 0 ) ;
haClose = ( O + H + L + C ) / 4 ;
haOpen = ( haOpen[1] + haClose[1] ) / 2 ;
haHigh = MaxList( H, haOpen, haClose ) ;
haLow = MinList( L, haOpen, haClose ) ;
TrLinIDLoHi = TL_New( Date, Time, haLow, Date, Time,
haHigh ) ;
SizeFuncRtn = TL_SetSize( TrLinIDLoHi,
ShadowThickness ) ;
ColorFuncRtn = TL_SetColor( TrLinIDLoHi, ShadowColor ) ;
TrLinIDOpCl = TL_New( Date, Time, haOpen, Date, Time,
haClose ) ;
if haOpen <= haClose then
 ColorFuncRtn = TL_SetColor( TrLinIDOpCl,
UpBodyColor )
else
 ColorFuncRtn = TL_SetColor( TrLinIDOpCl,
DownBodyColor ) ;
SizeFuncRtn = TL_SetSize( TrLinIDOpCl, BodyThickness ) ;
Indicator: haOpen
variables:
 haClose( 0 ),
 haOpen( 0 ),
 HaHigh( 0 ),
 haLow( 0 ) ;
haClose = ( O + H + L + C ) / 4 ;
haOpen = ( haOpen[1] + haClose[1] ) / 2 ;
Plot1( haOpen , "haOpen" ) ;
Indicator: haDiff
variables:
 haClose( 0 ),
 haOpen( 0 ),
 HaHigh( 0 ),
 haLow( 0 ) ;
haClose = ( O + H + L + C ) / 4 ;
haOpen = ( haOpen[1] + haClose[1] ) / 2 ;
haHigh = MaxList( H, haOpen, haClose ) ;
haLow = MinList( L, haOpen, haClose ) ;
Plot1( haClose ? haOpen, "C-O" ) ;
Plot2( Average( haClose - haOpen, 3 ), "haAvg" ) ;
A zip file including the above EasyLanguage code and an associated
workspace will be available for download from the EasyLanguage Exchange
on www.tradestationworld.com. Look for the file "Heikin Ashi.zip."
--Mark Mills
MarkM@TSSec at www.TradeStationWorld.com
EasyLanguage Questions Forum
TradeStation Securities, Inc.
A subsidiary of TradeStation Group, Inc.
![]() AMIBROKER: Heikin-Ashi Technique
AMIBROKER: Heikin-Ashi Technique
In "Using The Heikin-Ashi Technique," Dan Valcu presents a new candlestick charting technique based on modified open-high-low-close values. The charts presented in the article can easily be reproduced using AmiBroker Formula Language.

FIGURE 2: AMIBROKER, HEIKIN-ASHI TECHNIQUE. Shown here is the daily S&P 500 modified candlestick chart (upper pane), classic candlestick chart (middle pane), and HaDiffCO indicator with three-day moving average (lower pane).
Listing 1 shows ready-to-use code that produces the modified candlestick
charts. Listing 2 shows the code for the haDiffCO indicator presented in
the article.
LISTING 1
HaClose = (O+H+L+C)/4;
HaOpen = AMA( Ref( HaClose, -1 ), 0.5 );
HaHigh = Max( H, Max( HaClose, HaOpen ) );
HaLow = Min( L, Min( HaClose, HaOpen ) );
PlotOHLC( HaOpen, HaHigh, HaLow, HaClose, "Modified " + Name(), colorBlack, styleCandle );
LISTING 2
HaClose = (O+H+L+C)/4;
HaOpen = AMA( Ref( HaClose, -1 ), 0.5 );
HaHigh = Max( H, Max( HaClose, HaOpen ) );
HaLow = Min( L, Min( HaClose, HaOpen ) );
HaDiffCO = HaClose - HaOpen;
per = Param("MA Periods", 3, 3, 50, 1 );
Plot( HaDiffCo, "HaDiffCO", colorRed );
Plot( MA( HaDiffCo, per ), "MA("+per+")", colorBlue );
A downloadable version of this code is available from AmiBroker.com.
--Tomasz Janeczko, AmiBroker.com
www.amibroker.com
![]() eSIGNAL: Heikin-Ashi Technique
eSIGNAL: Heikin-Ashi Technique
Here are the eSignal formulas for the three indicators described in Dan Valcu's article, "Using The Heikin-Ashi Technique." Sample charts of each indicator are shown in Figures 3, 4, and 5.

FIGURE 3: eSIGNAL, HEIKIN-ASHI. Here's a heikin-ashi candlestick chart as displayed in eSignal.
FIGURE 4: eSIGNAL, HEIKIN-ASHI. Here's the heikin-ashi open-close indicator displayed in eSignal.
FIGURE 5: eSIGNAL, HEIKIN-ASHI. Here's the heikin-ashi DiffCO indicator displayed in eSignal.
/*****************************************************************
Provided By : eSignal. (c) Copyright 2003
EFS Formula : Heikin-Ashi
Notes:
* Non-price study
* Draws most recent 200 bars
* Formula Parameters
    - Bullish Color     Default: Green
    - Bearish Color     Default: Red
*****************************************************************/
function preMain() {
    setStudyTitle("Heikin-Ashi Chart ");
    setCursorLabelName("HA-High", 0);
    setCursorLabelName("HA-Low", 1);
    setCursorLabelName("HA-Open", 2);
    setCursorLabelName("HA-Close", 3);
    setDefaultBarFgColor(Color.black, 0);
    setDefaultBarFgColor(Color.black, 1);
    setDefaultBarFgColor(Color.black, 2);
    setDefaultBarFgColor(Color.black, 3);
    setPlotType(PLOTTYPE_DOT, 0);
    setPlotType(PLOTTYPE_DOT, 1);
    setPlotType(PLOTTYPE_DOT, 2);
    setPlotType(PLOTTYPE_DOT, 3);
    setDefaultBarThickness(0, 0);
    setDefaultBarThickness(0, 1);
    setDefaultBarThickness(0, 2);
    setDefaultBarThickness(0, 3);
    var fp1 = new FunctionParameter("cBull", FunctionParameter.COLOR);
    fp1.setName("Bullish Candles");
    fp1.setDefault(Color.green);
    var fp2 = new FunctionParameter("cBear", FunctionParameter.COLOR);
    fp2.setName("Bearish Candles");
    fp2.setDefault(Color.red);
}
var haClose = null;
var haOpen = null;
var haClose1 = null;
var haOpen1 = null;
var iCntr = 0;
function main(cBull, cBear) {
    var nState = getBarState();

    if (nState == BARSTATE_NEWBAR) {
        if ((haClose == null || haOpen == null) && close(-1) != null) {
            haClose = close(-1);
            haOpen = open(-1);
        }
        haClose1 = haClose;
        haOpen1 = haOpen;
        iCntr += 1;
        if (iCntr > 200) iCntr = 0;
    }
    if (haClose1 == null || haOpen1 == null) return;

    haOpen = (haOpen1 + haClose1) / 2;
    haClose = (open() + high() + low() + close()) / 4;
    var haHigh = Math.max(high(), haOpen, haClose);
    var haLow = Math.min(low(), haOpen, haClose);

    //candlesticks
    var vColor = Color.black;
    if (haClose > haOpen) vColor = cBull;
    if (haClose < haOpen) vColor = cBear;
    setBarFgColor(vColor, 2);
    setBarFgColor(vColor, 3);
    drawLineRelative(0, haHigh, 0, haLow, PS_SOLID, 1, Color.black, "Shadow"+iCntr);
    drawLineRelative(0, haOpen, 0, haClose, PS_SOLID, 3, vColor, "Body"+iCntr);

    var retArray = new Array(4);
    retArray[0] = haHigh.toFixed(2)*1;
    retArray[1] = haLow.toFixed(2)*1;
    retArray[2] = haOpen.toFixed(2)*1;
    retArray[3] = haClose.toFixed(2)*1;
    return retArray;
} // End of Heikin-Ashi code
/*****************************************************************
Provided By : eSignal. (c) Copyright 2003
EFS Formula : Heikin-Ashi DiffCO Indicator
Notes:
* Non-price study
* Formula Parameters
    - SMA Periods               Default: 3
    - HA-DiffCO Color           Default: Blue
    - SMA HA-DiffCO Color       Default: Red
    - HA-DiffCO Thickness       Default: 2
    - SMA HA-DiffCO Thickness   Default: 2
*****************************************************************/
function preMain() {
    setStudyTitle("Heikin-Ashi DiffCO Indicator ");
    setCursorLabelName("HA-DiffCO", 0);
    setCursorLabelName("SMA HA-DiffCO", 1);
    var fp0 = new FunctionParameter("nLength", FunctionParameter.NUMBER);
    fp0.setName("SMA Periods");
    fp0.setLowerLimit(1);
    fp0.setDefault(3);
    var fp1 = new FunctionParameter("cDiffCO", FunctionParameter.COLOR);
    fp1.setName("HA-DiffCO Color");
    fp1.setDefault(Color.blue);
    var fp2 = new FunctionParameter("cMADiffCO", FunctionParameter.COLOR);
    fp2.setName("SMA HA-DiffCO Color");
    fp2.setDefault(Color.red);

    var fp3 = new FunctionParameter("nDThickness", FunctionParameter.NUMBER);
    fp3.setName("HA-DiffCO Thickness");
    fp3.setLowerLimit(1);
    fp3.setDefault(2);
    var fp4 = new FunctionParameter("nMAThickness", FunctionParameter.NUMBER);
    fp4.setName("SMA HA-DiffCO Thickness");
    fp4.setLowerLimit(1);
    fp4.setDefault(2);
}
var haClose = null;
var haOpen = null;
var haClose1 = null;
var haOpen1 = null;
var bEdit = true;
var aDiffCO = null;
var haDiffCO = null;
function main(nLength, cDiffCO, cMADiffCO, nDThickness, nMAThickness) {
    var nState = getBarState();
    var i = 0;
    var dSum = 0;

    if (bEdit == true) {
        setDefaultBarFgColor(cDiffCO, 0);
        setDefaultBarFgColor(cMADiffCO, 1);
        setDefaultBarThickness(nDThickness, 0);
        setDefaultBarThickness(nMAThickness, 1);
        aDiffCO = new Array(nLength);
        bEdit = false;
    }

    if (nState == BARSTATE_NEWBAR) {
        if ((haClose == null || haOpen == null) && close(-1) != null) {
            haClose = close(-1);
            haOpen = open(-1);
        }
        haClose1 = haClose;
        haOpen1 = haOpen;
        if (haDiffCO != null) {
            aDiffCO.pop();
            aDiffCO.unshift(haDiffCO);
        }
    }
    if (haClose1 == null || haOpen1 == null) return;
    haOpen = (haOpen1 + haClose1) / 2;
    haClose = (open() + high() + low() + close()) / 4;
    haDiffCO = (haClose - haOpen);
    aDiffCO[0] = haDiffCO;

    var vMA = null;
    if (aDiffCO[nLength-1] != null) {
        for (i = 0; i < nLength; ++i) {
            dSum += aDiffCO[i];
        }
        vMA = (dSum / nLength);
    }

    var retArray = new Array(2);
    retArray[0] = haDiffCO.toFixed(2)*1;
    retArray[1] = vMA;
    return retArray;
} // End of Heikin-Ashi DiffCO Indicator code
/*****************************************************************
Provided By : eSignal. (c) Copyright 2003
EFS Formula : Heikin-Ashi Open Close Indicator
Notes:
* Non-price study
* Formula Parameters
    - HA-Open Color         Default: Red
    - HA-Close Color        Default: Blue
    - HA-Open Thickness     Default: 2
    - HA-Close Thickness    Default: 2
*****************************************************************/
function preMain() {
    setStudyTitle("Heikin-Ashi Open Close Indicator ");
    setCursorLabelName("HA-Open", 0);
    setCursorLabelName("HA-Close", 1);
    var fp1 = new FunctionParameter("cOpen", FunctionParameter.COLOR);
    fp1.setName("HA-Open Color");
    fp1.setDefault(Color.red);
    var fp2 = new FunctionParameter("cClose", FunctionParameter.COLOR);
    fp2.setName("HA-Close Color");
    fp2.setDefault(Color.blue);
    var fp3 = new FunctionParameter("nOThickness", FunctionParameter.NUMBER);
    fp3.setName("HA-Open Thickness");
    fp3.setLowerLimit(1);
    fp3.setDefault(2);
    var fp4 = new FunctionParameter("nCThickness", FunctionParameter.NUMBER);
    fp4.setName("HA-Close Thickness");
    fp4.setLowerLimit(1);
    fp4.setDefault(2);
}
var haClose = null;
var haOpen = null;
var haClose1 = null;
var haOpen1 = null;
var bEdit = true;
function main(cOpen, cClose, nOThickness, nCThickness) {
    var nState = getBarState();
    if (bEdit == true) {
        setDefaultBarFgColor(cOpen, 0);
        setDefaultBarFgColor(cClose, 1);
        setDefaultBarThickness(nOThickness, 0);
        setDefaultBarThickness(nCThickness, 1);
        bEdit = false;
    }
    if (nState == BARSTATE_NEWBAR) {
        if ((haClose == null || haOpen == null) && close(-1) != null) {
            haClose = close(-1);
            haOpen = open(-1);
        }
        haClose1 = haClose;
        haOpen1 = haOpen;
    }
    if (haClose1 == null || haOpen1 == null) return;

    haOpen = (haOpen1 + haClose1) / 2;
    haClose = (open() + high() + low() + close()) / 4;

    var retArray = new Array(2);
    retArray[0] = haOpen.toFixed(2)*1;
    retArray[1] = haClose.toFixed(2)*1;
    return retArray;
} // End of Heikin-Ashi Open Close Indicator code
--eSignal, a division of Interactive Data Corp.
800 815-8256, www.esignal.com
![]() AIQ EXPERT DESIGN STUDIO: Heikin-Ashi Technique
AIQ EXPERT DESIGN STUDIO: Heikin-Ashi Technique
Here is the AIQ TradingExpert code based on "Using The Heikin-Ashi
Technique" by Dan Valcu.
!!!  Stocks & Commodities February 2004
!!!  Using the Heikin-Ashi Technique, by Dan Valcu
O is [open].
H is [high].
L is [low].
C is [close].
YO is val([open], 1).
YC is val([close], 1).
haClose is (O + H + L + C) / 4.
haOpen is (YO + YC) / 2.
ma1 is max(H, haOpen).
ma2 is max(haOpen, haClose).
ma3 is max(haClose, H).
ma4 is max(ma1,ma2).
ma5 is max(ma2,ma3).
haHigh is max(ma4,ma5).
mi1 is min(L, haOpen).
mi2 is min(haOpen, haClose).
mi3 is min(haClose, L).
mi4 is min(mi1,mi2).
mi5 is max(mi2,mi3).
haLow is max(mi4,mi5).
haDiffCO is haClose - haOpen.
MovhaDiffCO is simpleavg(haDiffCO, 3).
A sample chart is shown in Figure 6.
FIGURE 6: AIQ, HEIKIN-ASHI CANDLESTICK CHART. Here's a sample chart in AIQ Design Expert studio.
--Mike Kaden
AIQ Systems
www.aiq.com
![]() WEALTH-LAB: Heikin-Ashi Technique
WEALTH-LAB: Heikin-Ashi Technique
There are several methods of representing new chart styles using the Wealth-Lab platform. Wealth-Lab Developer 3.0 offers an ActiveX Api so that developers can program new chart styles that integrate into the product using a programming tool such as Visual Basic, Delphi, or C++. Since the heikin-ashi method simply changes the OHLC values of the existing candlesticks, another alternative would be to use the WealthScript ChangeBar function to modify the OHLC values of the data series and then display the chart in standard candlestick format.
We selected a third option and created a synthetic data series using the new OHLC values. We plotted the new heikin-ashi data series above the original candlestick chart so the trader can compare the two values.
Note that the haDiffCO indicator can be created in a very simple and straightforward manner using our WealthScript language. The script given here creates the indicator and plots it on the chart along with a five-bar simple moving average (Figure 7).

FIGURE 7: WEALTH-LAB, HEIKIN-ASHI CANDLESTICK CHART. The heikin-ashi chart is displayed above the normal candlestick chart for comparison. The haDiffCO indicator and a five-bar simple moving average occupy the lower chart pane.
You can also run this script on the free Wealth-Lab.com website.
Select the "ChartScripts" main menu. Then click Search. Enter
"heikin" in the Title Search and press the Submit button.
The "Heikin-Ashi" script will be shown in the search results.
You can execute the script directly from the website and view heikin-ashi
charts of any US stock (Figure 8).

FIGURE 8: WEALTH-LAB, HEIKIN-ASHI CANDLESTICK CHART. You can execute the script on any US stock symbol.
WealthScript code:
var Bar, HO, HH, HL, HC: integer;
var o, h, l, c, o1, c1: float;
var hPane, haDiffCO, haIndPane: integer;
{ Create Heikin-Ashi OHLC Price Series }
HO := CreateSeries;
HH := CreateSeries;
HL := CreateSeries;
HC := CreateSeries;
{ Initialize first bar to values of price }
@HO[0] := PriceOpen( 0 );
@HH[0] := PriceHigh( 0 );
@HL[0] := PriceLow( 0 );
@HC[0] := PriceClose( 0 );
{ Populate Heikin-Ashi Chart }
for Bar := 1 to BarCount - 1 do
begin
  o := PriceOpen( Bar );
  h := PriceHigh( Bar );
  l := PriceLow( Bar );
  c := PriceClose( Bar );
  o1 := PriceOpen( Bar - 1 );
  c1 := PriceClose( Bar - 1 );
  @HC[Bar] := ( o + h + l + c ) / 4;
  @HO[Bar] := ( o1 + c1 ) / 2;
  @HH[Bar] := Max( Max( o1, c1 ), h );
  @HL[Bar] := Min( Min( o1, c1 ), l );
end;
{ Plot it }
hPane := CreatePane( 250, true, true );
PlotSyntheticSymbol( 'heikin-ashi', HO, HH, HL, HC, hPane, #Navy, #Candle );
DrawLabel( 'heikin-ashi', hPane );
{ Calculate and plot the haDiffCO indicator }
HideVolume;
haDiffCO := SubtractSeries( HC, HO );
haIndPane := CreatePane( 100, false, true );
PlotSeriesLabel( haDiffCO, haIndPane, #Lime, #ThickHist, 'haDiffCO' );
PlotSeriesLabel( SMASeries( haDiffCO, 5 ), haIndPane, #Green, #Thick, 'SMA(5)' );
--Dion Kurczek, Wealth-Lab, Inc.
www.wealth-lab.com
![]() NEUROSHELL TRADER: Heikin-Ashi Technique
NEUROSHELL TRADER: Heikin-Ashi Technique
The heikin-ashi indicators as described by Dan Valcu can be easily implemented in NeuroShell Trader (Figure 9) by combining a few of NeuroShell Trader's 800 indicators. To implement the indicators, select "New Indicator É" from the Insert menu and use the Indicator Wizard to create the following indicators:

FIGURE 9: NEUROSHELL TRADER, HEIKIN-ASHI CANDLESTICK CHART. Here's a sample chart in NeuroShell Trader.
haClose:
    Average4 ( Open, High, Low, Close )
haOpen:
    ExpAvg ( haClose, 3 )
haHigh:
    Max3 ( High, haOpen, haClose )
haLow:
    Min3 ( Low, haOpen, haClose )
haDiffCo:
    Subtract ( haClose, haOpen )
MOV-haDiffCo:
    SimpleMovAvg ( haDiffCo, Periods )
Users of NeuroShell Trader can go to the Stocks & Commodities
section of the NeuroShell Trader free technical support website to download
a sample chart that includes the heikin-ashi technique indicators.
For more information on NeuroShell Trader, visit www.NeuroShell.com.
--Marge Sherald, Ward Systems Group, Inc.
301 662-7950, sales@wardsystems.com
www.neuroshell.com
![]() NEOTICKER: Heikin-Ashi Technique
NEOTICKER: Heikin-Ashi Technique
NeoTicker can plot candlesticks from indicator-calculated results, by using formula language, along with indicator on indicator. The concept presented in "Using The Heikin-Ashi Technique" by Dan Valcu can be implemented easily.
First, create a formula indicator called ha_series (Listing 1) to plot the custom candlesticks. This indicator returns four plots that correspond to Ohlc of heikin-ashi candlesticks. It uses the special plot style called "candle," which interprets the indicator values into candles on the charts.
By applying the indicator ha_series onto the Spx, you will get the heikin-ashi candlesticks of Spx (Figure 10).
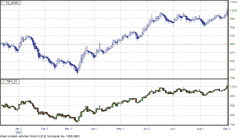
FIGURE 10: NEOTICKER, HEIKIN-ASHI CHART of S&P. By applying the indicator ha_series to the SPX, you will get the heikin-ashi candlesticks of SPX.
Apply the ha_series indicator to the ULTI data series. The result
is heikin-ashi candlesticks of ULTI.
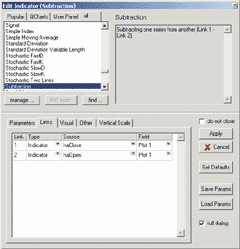
Next, use NeoTicker's built-in indicator "Plot Value" to separate haOpen and haClose from ha_series. Then apply the indicator "Subtract" to create haDiffCo. Last, apply "moving average" to create Mov-haDiffCo (Figure 11).
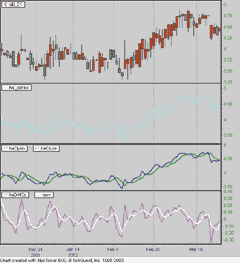
FIGURE 11: NEOTICKER, HEIKIN-ASHI CHART. Apply the indicator "Subtract" to create haDiffCo. Last, apply "moving average" to create Mov-haDiffCo.
Apply the "plot value" indicator to the ha_series.
Enter 1 at the plot parameter because the first plot of ha_series is haOpen.
Then enter "haOpen" in the Label entry to identify this indicator
with a name.
Apply another "plot value" indicator to the ha_series. This time, enter 4 at the plot parameter because the fourth plot of ha_series is haClose. Enter "haClose" in the Label entry.
Apply the "subtract" indicator to haOpen, enter "haDiffCo" in the Label entry. At the Link tab of the "Add indicator" window, change link 1 to haClose and link 2 to haOpen (Figure 12). The result is the difference between haClose and haOpen.
FIGURE 12: NEOTICKER, HEIKIN-ASHI CHART. At the Link tab of the "Add indicator" window, change link 1 to haClose and link 2 to haOpen. The result is the difference between haClose and haOpen.
Apply the "moving average" indicator to haDiffCo.
Then enter 3 in the period parameter. The result is a three-period simple
moving average of haDiffCo.
LISTING 1
haClose := (O+H+L+C)/4;
haOpen  := (haOpen(1)+haClose(1))/2;
myH1    := if(H > haOpen, H, HaOpen);
haHigh  := if(myH1 > haClose, myH1, haClose);
myL1    := if(L < haOpen, L, HaOpen);
haLow   := if(myL1 < haClose, myL1, haClose);
plot1 := haOpen;
plot2 := haHigh;
plot3 := haLow;
plot4 := haClose;
Downloadable versions of these indicators will be available
from the Yahoo! NeoTicker user group file area at https://groups.yahoo.com/group/neoticker/.
--Kenneth Yuen, TickQuest Inc.
www.tickquest.com
![]() TRADINGSOLUTIONS: Heikin-Ashi Technique
TRADINGSOLUTIONS: Heikin-Ashi Technique
In "Using The Heikin-Ashi Technique," Dan Valcu presents calculations for using different high, low, open, and close values when working with candlestick charts and equations.
These values can be calculated as follows:
Name: Heikin-Ashi Close
Short Name: haClose
Inputs: Open, High, Low, Close
Formula:
Div (Add (Add (Open,High),Add (Low,Close)),4)
Name: Heikin-Ashi Open
Short Name: haOpen
Inputs: Open, High, Low, Close
Formula:
Avg (Prev (1),Lag (haClose (Open,High,Low,Close),1))
Name: Heikin-Ashi High
Short Name: haHigh
Inputs: Open, High, Low, Close
Formula:
Max (High,Max (haOpen (Open,High,Low,Close),haClose (Open,High,Low,Close)))
Name: Heikin-Ashi Low
Short Name: haLow
Inputs: Open, High, Low, Close
Formula:
Min (Low,Min (haOpen (Open,High,Low,Close),haClose (Open,High,Low,Close)))
In addition to alternate values for high, low, open, and close,
new difference and moving difference equations are also presented:
Name: Heikin-Ashi Close-Open Difference
Short Name: haDiffCO
Inputs: Open, High, Low, Close
Formula:
Sub (haClose (Open,High,Low,Close),haOpen (Open,High,Low,Close))
Name: Heikin-Ashi Moving Difference
Short Name: Mov-haDiffCO
Inputs: Open, High, Low, Close, Period
Formula:
MA (haDiffCO (Open,High,Low,Close),Period)
TradingSolutions cannot use alternate price values in candlestick
charts. However, the functions listed above can be charted normally; used
in entry/exit system rules; and used as inputs to neural network models.
When used as inputs, set preprocessing to "percent change"
for the alternate price values, since they will typically not remain in
a fixed range. For difference values, set preprocessing to "none."
These functions are available in a function file that can be downloaded from the TradingSolutions website in the Solution Library section.
--Gary Geniesse, NeuroDimension, Inc.
800 634-3327, 352 377-5144
www.tradingsolutions.com
![]() INVESTOR/RT: Heikin-Ashi Technique
INVESTOR/RT: Heikin-Ashi Technique
The heiken-ashi technique discussed in Dan Valcu's article "Using The Heikin-Ashi Technique" can be implemented in Investor/RT using two indicators: price bands and custom indicators. The chart in Figure 13 displays the heiken-ashi candles in the top pane, the raw candles (or Msft) in the middle pane, and the haDiffCo indicator (along with a three-period smoothing of haDiffCo) in the lower pane.
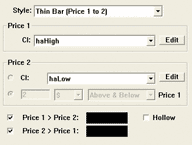
The heiken-ashi candles are implemented using two price band indicators (one for the body and one for the candle wicks). The body is drawn using the price band preferences shown in Figure 14. The candle wicks are drawn using the price band preferences shown in Figure 15.
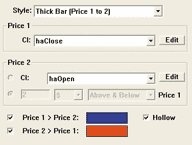
FIGURE 14: INVESTOR/RT PREFERENCE SETTINGS. Shown are the preferences for the price band used to draw the body of the heiken-ashi candles.
FIGURE 15: INVESTOR/RT PREFERENCE SETTINGS. Shown are the preferences for the price band used to draw the wicks of the heiken-ashi candles.
Custom indicators must be created to represent the high, low, open,
and close of the candles. The syntax for each of these custom indicators
follows:
Custom Indicator:  haClose
Syntax:  OHLC
Notes: The OHLC token gives (OP + HI + LO + CL)/4
Custom Indicator:  haOpen
Syntax:  MA.1
Notes:  The MA (Moving Average) is setup as a 3 period exponential smoothing of OHLC/4.
        This in effect, gives the same result as (haOpen.1 + haClose.1)/2
Custom Indicator:  haHigh
Syntax: SMAX(HI, SMAX(OHLC, MA.1))
Notes:  This statement essentially gives the maximum of high, haClose, and haOpen
Custom Indicator:  hallow
Syntax: SMIN(LO, SMIN(OHLC, MA.1))
Notes:  This statement essentially gives the minimum of low, haClose, and haOpen
You can access additional information regarding the Investor/RT
features of price bands and custom indicators by visiting the following
pages:
https://www.linnsoft.com/tour/techind/bands.htm
https://www.linnsoft.com/tour/customIndicator.htm
--Chad Payne, Linn Software
800-546-6842, info@linnsoft.com
www.linnsoft.com
![]() TECHNIFILTER PLUS: Heikin-Ashi Technique
TECHNIFILTER PLUS: Heikin-Ashi Technique
Creating and updating historical ASCII datafiles for heikin-ashi charts can easily be done on a daily basis in TechniFilter Plus using the automation function. The resulting ASCII datafiles can then be charted directly without any further conversion required.
The following four steps can be used to create the historical datafiles.
The formulas discussed in "Using The Heikin-Ashi Technique"
by Dan Valcu in this issue are included at the end.
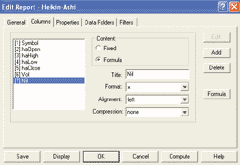
Creating historical heikin-ashi datafiles Step 1: Create a list named HEIKIN.LST of the required stocks or indices for which to create historical datafiles. For example: S&P 500, gold, US dollar index, a stock, and so on (use "File, New List" from the menu) (Figure 16). Step 2: Next create a Filter Report (Figure 17) named HEIKIN.ASHI with the following formulas or columns:Filter Report FORMULAS [1] Symbol [2] haOpen (Recursive, Multiline formula Initial value O) [1]: (O+H+L+C)/4 {haClose} [2]: O*TY1/O {r} [3]: (([1]Y1+[2])/2) [3] haHigh ((O+H+L+C)/4)%[2]%H [4] haLow ((O+H+L+C)/4)#[2]#L [5] haClose (O+H+L+C)/4 [6] Vol V [7] Nil (Recursive, Multiline formula Initial value O) [1]: (O+H+L+C)/4 {I2} [2]: O*TY1/O {r}
Step 3: Create a TechniFilter Automation named "Heikin"
for making and updating the historical ASCII datafiles for the required
issues, using the "Make history" button (Figure 18):
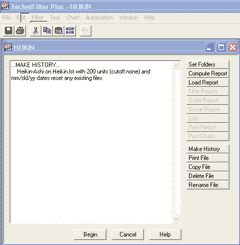
FIGURE 18: TECHNIFILTER PLUS: Ha_auto. Use the "Make history" button to automate the creating and updating of the required ASCII historical datafiles.
Automation code
...MAKE HISTORY...
Heikin-ashi on heikin.lst with 200 units (cutoff:none)
and mm/dd/yy dates reset any existing files
{Change the number of periods from 200 periods or days to your required
data file size}
Step 4: Click the Begin button to run the heikin automation and create your heikin-ashi Ascii historical datafiles. The new heikin-ashi historical datafiles will be placed in a subfolder in TechniFilter called "Heikin-ashi."
To chart the heikin-ashi datafiles, click the "Chart issue" menu item, and browse to the new C:\TECHNIFILTER\Heikin-Ashi subdirectory, and select an issue to chart (Figure 19).
Here are the TechniFilter Plus formulas used in the above filter reports and charts (Figures 19?21):

FIGURE 19: TECHNIFILTER PLUS: Ha_ChartOpen. Select an issue to chart, and use the back and next arrows to scroll through the heikin-ashi charts.
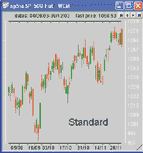
FIGURE 20: TECHNIFILTER PLUS: ha_ChartStandard. Here's a standard candlestick chart of the S&P 500.
FIGURE 21: TECHNIFILTER PLUS: ha_ChartHeikin. For comparison, here's a heikin-ashi chart of the S&P 500.
haOpen
SWITCHES: multiline   recursive
INITIAL VALUE: O
FORMULA:
[1]: (O+H+L+C)/4
[2]: O*TY1/O {r}
[3]: (([1]Y1+[2])/2)
haClose
FORMULA:
(O+H+L+C)/4
haDiffCo
SWITCHES: multiline   recursive
INITIAL VALUE: O
FORMULA:
[1]: (O+H+L+C)/4 {I2}
[2]: O*TY1/O {r}
[3]: (([1]Y1+[2])/2)
[4]: [1]-[3] {c}{NhaDiffCo}{nc}{a}  {rgb#255}
Visit the new home of TechniFilter Plus at www.technifilter.com
to download these formulas and program updates.
--Benzie Pikoos, BrightsparkGO BACK
Tel +61 8 9375-1178, sales@technifilter.com
www.technifilter.com
![]() StockWiz: Heikin-Ashi Technique
StockWiz: Heikin-Ashi Technique
The following formula for StockWiz 4.0 issues trading signals based on two indicators: the haDiffCo indicator, described by Dan Valcu in this issue, and a five-day simple moving average of the haClose price.
Buy signals are issued when:
a) The haClose price is greater than the haOpen (that is, the haDiffCo
is greater than zero), and
b) The haClose is above its five-day simple moving average.
Sell signals are generated when:
a) The haClose price is less than or equal to the haOpen, and
b) The haClose price is below or equal to its simple moving average.
If only one of the two conditions (a and b) holds in either case above,
the formula issues a neutral signal.
The results are displayed in the worksheet where the user can
view charts with other technical analysis indicators.
_______________________
# Clear all contents of the worksheet
(CLEAR)
(SOURCE "WORKING_GROUP")
# Set number of rows in worksheet equal to
# the number of entries in the Working Group.
(SET I 0)
(SET TOTAL (DBSIZE))
# Write labels to the output grid
(GRIDFIELD "Name" "STRING" "25")
(GRIDFIELD "Open" "STRING" "10")
(GRIDFIELD "Close" "STRING" "10")
(GRIDFIELD "haOpen" "STRING" "10")
(GRIDFIELD "haClose" "STRING" "10")
(GRIDFIELD "haDiffCo" "STRING" "10")
(GRIDFIELD "SMA_value" "STRING" "10")
(GRIDFIELD "Signal" "STRING" "10")
# Load the first company in the worksheet
(SET STATUS (LOADFIRST))
(GOTO %ERROR (NE STATUS 0))
%NEXT:
# Get the price vectors
(SET OPEN  (GETVECTOR (CURRENT) "OPEN"))
(SET HIGH  (GETVECTOR (CURRENT) "HIGH"))
(SET LOW   (GETVECTOR (CURRENT) "LOW"))
(SET CLOSE (GETVECTOR (CURRENT) "CLOSE"))
# Skip over this company if there are less
# than 10 values in the Close vector
(GOTO %UPDATE (LT (VSIZE CLOSE) 10))
# Get today's prices
(SET LASTOPEN  (GETDOUBLE "LastOpen"))
(SET LASTCLOSE (GETDOUBLE "LastClose"))
(SET LASTHIGH  (GETDOUBLE "LastHigh"))
(SET LASTLOW   (GETDOUBLE "LastLow"))
# The haClose values
(SET HAC1 (VADD OPEN HIGH))
(SET HAC2 (VADD LOW CLOSE))
(SET HAC3 (VADD HAC1 HAC2))
(SET HACL (VSDIV HAC3 4))
# Yesterday's Open/haOpen value
(SET HA_OP1 (VSIZE OPEN))
(SET HA_OP2 (SUB HA_OP1 2))
(SET HA_OPEN_prev (VGET OPEN HA_OP2))
# Yesterday's haClose value
(SET HA_CL1 (VSIZE HACL))
(SET HA_CL2 (SUB HA_CL1 2))
(SET HA_CLOSE_prev (VGET HACL HA_CL2))
# Today's haOpen value
(SET HA_OPEN1 (ADD HA_OPEN_prev HA_CLOSE_prev))
(SET HA_OPEN  (DIV HA_OPEN1 2))
# Today's haClose value
(SET HA_CL (VSIZE HACL))
(SET HA_CL (SUB HA_CL 1))
(SET HA_CLOSE (VGET HACL HA_CL))
# The haDiffCo indicator: haClose minus haOpen
(SET HA_DIFF (SUB HA_CLOSE HA_OPEN))
# The 5 day simple MA of the haClose price
(SET SMA_5 (MOVAVG HACL 5))
# The latest value of the 5 day simple MA
(SET SMA1 (VSIZE SMA_5))
(SET SMA2 (SUB SMA1 1))
(SET SMA_last (VGET SMA_5 SMA2))
# Add the data to the columns in the worksheet
(GRID (CURRENT) "Open"  (DOUBL2STR LASTOPEN "%.3lf"))
(GRID (CURRENT) "Close" (DOUBL2STR LASTCLOSE "%.3lf"))
(GRID (CURRENT) "haOpen" (DOUBL2STR HA_OPEN "%.3lf"))
(GRID (CURRENT) "haClose" (DOUBL2STR HA_CLOSE "%.3lf"))
(GRID (CURRENT) "haDiffCo" (DOUBL2STR HA_DIFF "%.3lf"))
(GRID (CURRENT) "SMA_value" (DOUBL2STR SMA_last "%.3lf"))
# Generate trading signals based on the haDiffCo and
# simple MA indicators
         (GOTO %BULL    (GT HA_DIFF 0.0))
         (GOTO %BEAR    (LE HA_DIFF 0.0))
%BULL:   (GOTO %BUY     (GT LASTCLOSE SMA_last))
         (GOTO %NEUTRAL (LE LASTCLOSE SMA_last))
%BEAR:   (GOTO %SELL    (LE LASTCLOSE SMA_last))
         (GOTO %NEUTRAL (GT LASTCLOSE SMA_last))
%BUY:    (SET SIGNAL "BUY")
         (GRID (CURRENT) "Name" (GETSTRING "NAME"))
         (GRID (CURRENT) "Signal" SIGNAL)
         (GOTO %UPDATE (TRUE))
%SELL:   (SET SIGNAL "SELL")
         (GRID (CURRENT) "Name" (GETSTRING "NAME"))
         (GRID (CURRENT) "Signal" SIGNAL)
         (GOTO %UPDATE (TRUE))
%NEUTRAL:(SET SIGNAL "Neutral")
         (GRID (CURRENT) "Name" (GETSTRING "NAME"))
         (GRID (CURRENT) "Signal" SIGNAL)
         (GOTO %UPDATE (TRUE))
%UPDATE: (SET I (ADD I 1))
# Exit formula if the user clicks on the Cancel button
(GOTO %EXIT (ESCAPE))
# Load the next company in the worksheet
(SET STATUS (LOADNEXT))
(GOTO %NEXT (EQ STATUS 0))
(GOTO %EXIT (TRUE))
%ERROR:
(MESSAGE "An error has occurred - Unable to continue")
%EXIT:   (EXIT 0)
--StockWizGO BACK
support@stockwiz.com
![]() Financial Data Calculator: Heikin-Ashi Technique
Financial Data Calculator: Heikin-Ashi Technique
Financial Data Calculator (Fdc) can easily reproduce the heikin-ashi open-high-low-close values as described by Dan Valcu in his article in this issue, "Using The Heikin-Ashi Technique."
As it is likely that the user will smooth many datasets with this tool,
it would be most useful to create a macro, illustrated here:
haClose:  ((op #R)+(hi #R)+(lo #R)+(cl #R))/4
haOpen:   .5 expave (haClose back 1)
haHigh:   (hi #R) max haOpen max haClose
haLow:    (lo #R) min haOpen min haClose
haOpen, haHigh, haLow, haClose
Enter this code into Fdc and define the macro as "HA."
Enter "HA Snp" or "HA Ibm" to produce the desired
output. Note that there are more efficient ways to define this macro in
Fdc, but the above text enables even the nonusers to follow the calculations.
#R refers to the "right argument" in a statement, which in
this case is the raw dataset.
This operation can be performed anywhere in FDC and can be a part of any other request by the user (such as trade simulation).
All traders should be aware that the value defined as the haOpen is an exponential smoothing of the haClose (and thus the entire bar), lagged one bar.
Here's to Dan Valcu for observing that candlestick charts of smoothed data can be very interesting.
--Robert C. BusbyGO BACK
Futures Software Associates, 856 857-9088
www.financialdatacalculator.com
All rights reserved. © Copyright 2004, Technical Analysis, Inc.
Return to February 2004 Contents


