Access to foreign exchange trading has opened up exciting trading options for the retail trader. You can now trade alongside corporations and institutions in a highly liquid market that is global, traded around the clock, and highly leveraged. Before jumping into this market, however, we must understand the factors that affect the forex market. With that in mind, STOCKS& COMMODITIES is introducing Forex Focus to better prepare the retail trader to participate in the currency market.
Are Fibonacci Levels Leading Indicators For Forex?
by Todd Gordon, CMT
Gain insight into the trading tactics of institutional foreign exchange traders.
The recent explosion in popularity of the cash foreign exchange markets has been fueled by investors from nearly every trading discipline, from hedge fund managers to commodity trading advisors (CTAs) to investment banks to individual traders. This influx of players contributes to the $1.9 trillion turned over daily in the foreign exchange markets, and it is the very size and source of this volume that allows skilled technical traders to place trades in the spot forex markets with relative safety.
So how do we safely navigate among the forces in the currency trading universe and live to tell the tale? The key lies in understanding the use of analytic indicators. Let's take a look.
EVERYBODY LOOKS AT TECHNICALS
Technical analysis existed in the 1970s and 1980s, but not to the degree that it does today. Thirty years ago, there was certainly no equivalent of eSignal or TradeStation running on every currency trader's desk in the interbank market. Those traders could not call up a 38.2% Fibonacci retracement for a recent move by clicking a mouse, nor could they easily pull up a real-time streaming chart to learn that the dollar/Swiss franc (USD/CHF) had held 1.1800 for the past month.
Far from it. Back then, when a large order hit a trader's desk, he either knew his technical levels beforehand, having organized and written them down days before, or simply guessed where to position himself ahead of this order. Today, in contrast, charting packages with advanced technical analytics litter the desks of just about every investing institution. Traders can call up technical indicators instantly for any investment instrument and position themselves accordingly. The markets are far different.
Further, the recent explosion in assets under management by hedge funds has drawn even more attention to technical levels. The most aggressive growth within the hedge fund category has been the sub-$250 million funds, which typically employ either automated technical strategies or discretionary position trading around technical levels.
The key here is that the recent increase in forex market activity has not come from the longer-term macro traders who have been trading this market for decades. It is the shorter-term speculators such as commodity trading advisors (CTAs), hedge funds, and individual traders who are adding volume at relatively the same technical levels. All this positioning at the same technical levels leads to explosive - yet tradable - volatility.
IMPORTANT TECHNICAL LEVELS
Let's take a look at some recent examples of largely order-driven, volatile levels that have turned into profitable trading opportunities utilizing our technical analysis abilities. The point here is to demonstrate how technical levels stand out in emotionally charged, volatile markets.
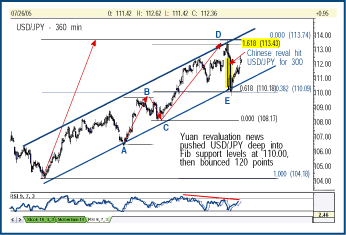
Figure 1 is a 360-minute chart of the US dollar/Japanese yen (USD/JPY), showing the Chinese yuan revaluation story that broke in late July. First, here's a quick recap of the fundamentals of the yuan revaluation. Essentially, Japan is China's largest trading partner, and a stronger yuan means a stronger export business for Japan, and thus a stronger yen. Rumors ran rampant in June that China planned to revalue its currency. Alert to the possibility that such news could trigger wild fluctuations in the currency market, USD/JPY buyers stayed on the sidelines in anticipation.

FIGURE 1: BREAKING NEWS: YUAN REVALUATED. Note that Fibonacci projection point D at 113.44 capped buying ahead of yuan revaluation news.
Instead, USD/JPY traded sideways to down in June and into early July. Finally, traders grew tired of the lack of action by China and bid USD/JPY up to its technical resistance zone of 113.60 (point D).
In this case, technical resistance consisted of Fibonacci projection levels 1.618 at 113.44, as well as the top end of a parallel trend channel. For those familiar with Fibonacci retracements but not yet fluent with projections, see Figure 2. A Fibonacci projection takes into account the distance between points A and B, then projects Fibonacci ratios up from point C to give you an exit target at point D. Many times, Fibonacci projections offer tremendous targets for exiting winning traders. Figure 3 illustrates a simple move from A to B, and the subsequent 50% retracement to 1.8964.
Return to October 2005 Contents